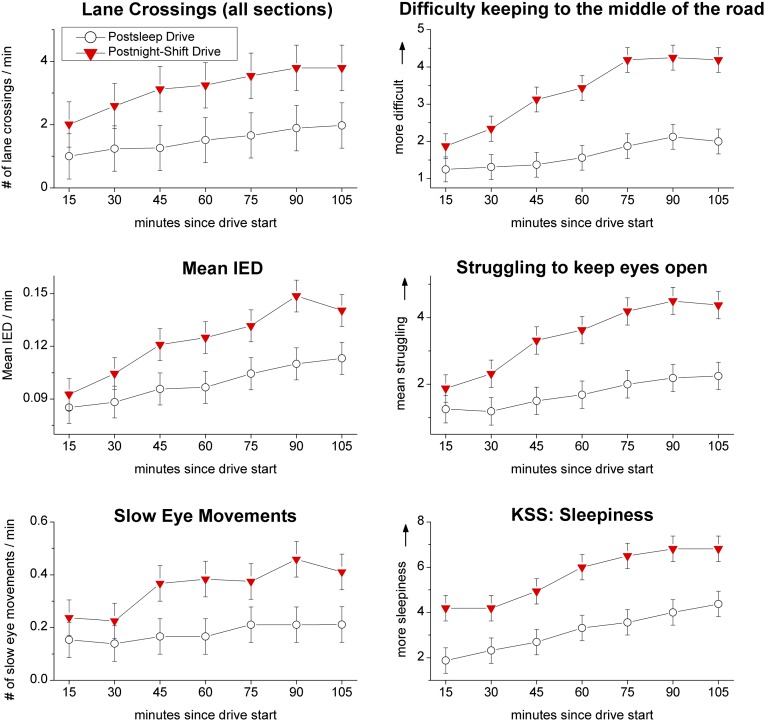
Fig. 2.
Drowsiness progressively increased across driving sessions. Driving performance, ocular, and survey measures of drowsiness are shown by drive condition and drive duration. Mean values with SE bars. For each of these variables except the KSS, there was a significant interaction effect of driving duration (driving block 1–7) by condition (P < 0.05). Condition alone had a significant effect on the KSS (P < 0.05). Tick marks indicate driving breaks, as in Fig. 1.

