Fig. 3.
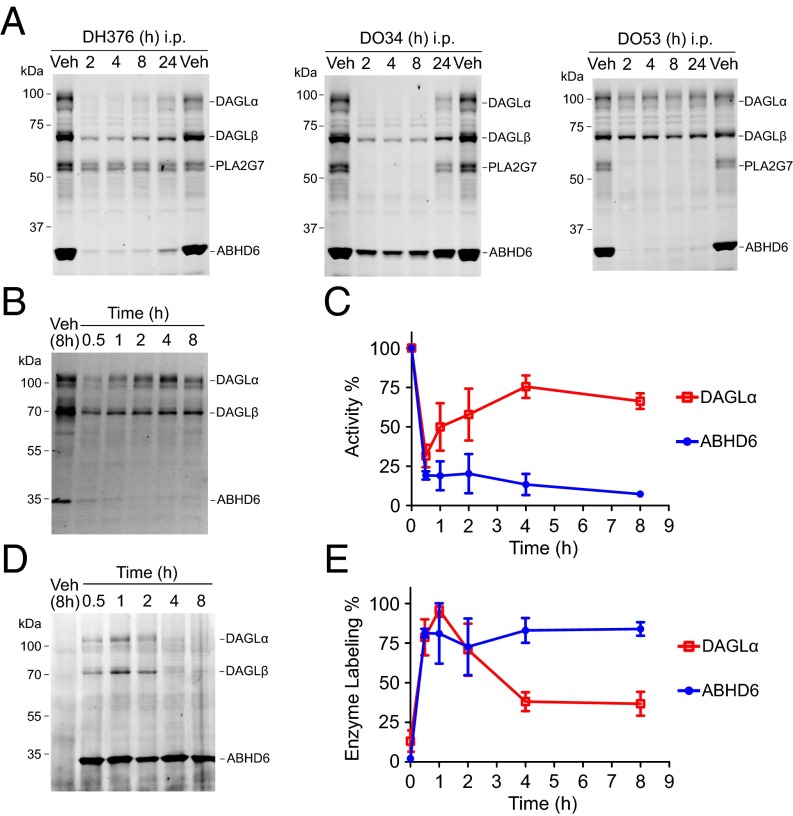
Time-course analysis of DAGLα inhibition and recovery. (A) Time course of inhibition of DAGLα in brain tissue from mice treated with vehicle (Veh) or DH376, DO34, and DO53 (50 mg/kg, i.p.) as determined by competitive ABPP using the DH379 probe (1 μM, 30 min). (B and C) Time course of inhibition of DAGLα in brain tissue from mice treated with a low dose of DH376 (3 mg/kg, i.p.) as determined by competitive ABPP using the DH379 probe (1 μM, 30 min). Gel data (B) and quantification of these data (C) relative to a vehicle-treated control group are shown for both DAGLα and ABHD6, an off-target of DH376. Data represent average values ± SEM; n = 3 mice per group. (D and E) Time course of direct labeling of DAGLα in brain tissue from mice treated with DH376 (3 mg/kg, i.p.) visualized by CuAAC to a Cy5 reporter group. Gel data (D) and quantification of these data (E) relative to a vehicle-treated control group are shown for both DAGLα and ABHD6. Data represent average values ± SEM; n = 3 mice per group.

