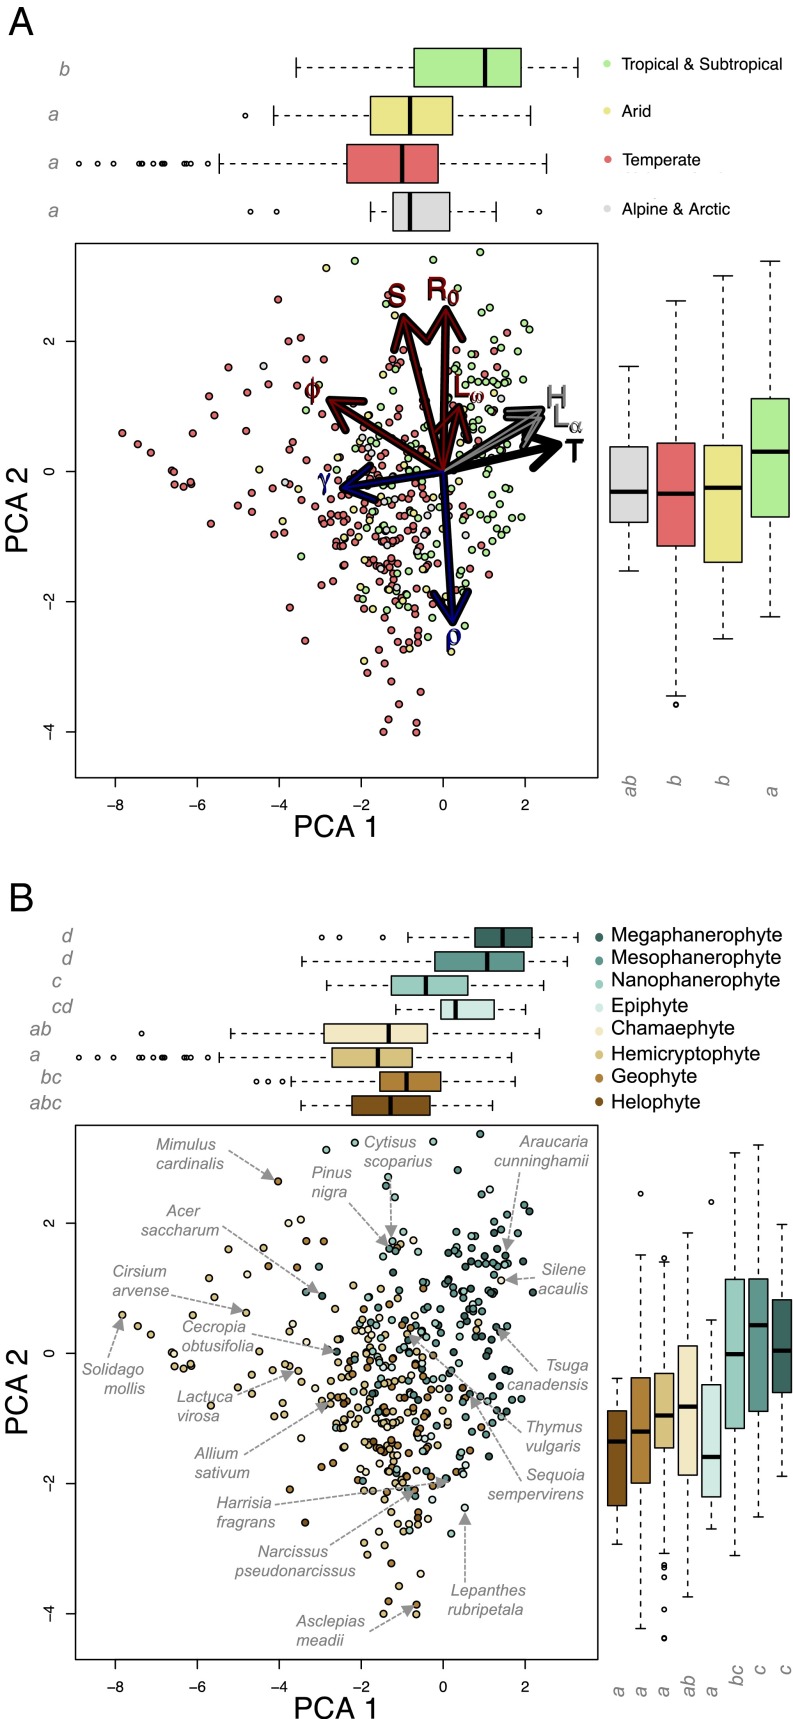
Fig. 2.
Life-history variation in vascular plants is characterized by life-history traits associated with the fast–slow continuum and reproductive strategies. Shown are phylogenetically corrected PCA of life-history traits in Table 1 with population turnover (black arrows) and traits related to longevity (gray), growth (dark blue), and reproduction (red). Arrow length indicates the loading of each life-history trait onto PCA axes. Points represent the position of species along the PCA 1 and 2 and are color-coded per major habitat (A) and Raunkiær’s growth form (B). Box-and-whisker plots on the top and right of each panel represent median (thick bar), upper and lower quartiles (edges of rectangle), and maximum and minimum (outer bars) excluding outliers (empty circles; >2/3 of the absolute value of the quartile) of PCAs 1 and 2. The differences between groups marked with different letters display statistically significant differences.

