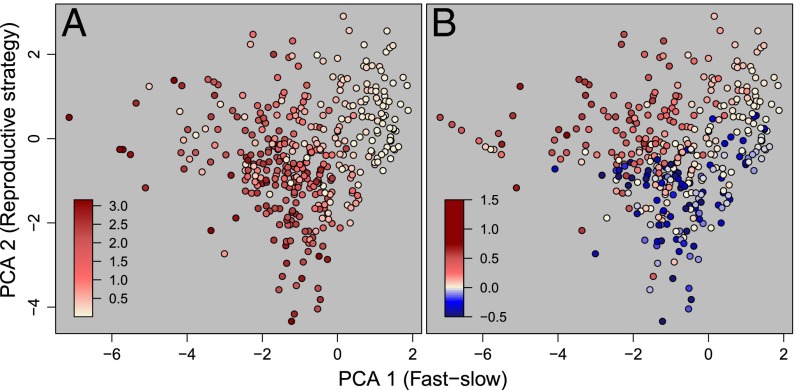
Fig. 3.
A species’ score on the fast–slow continuum and its reproduction strategy predict population performance including damping ratio (i.e., the rate at which a population returns to equilibrium after disturbance) (A) and the population growth rate (r = log(λ) (i.e., the rate of population size change through time) (B). Redder tones indicate a higher value of these metrics. Bluer colors of r reflect population decline. The damping ratio was quantified for 389 species.

