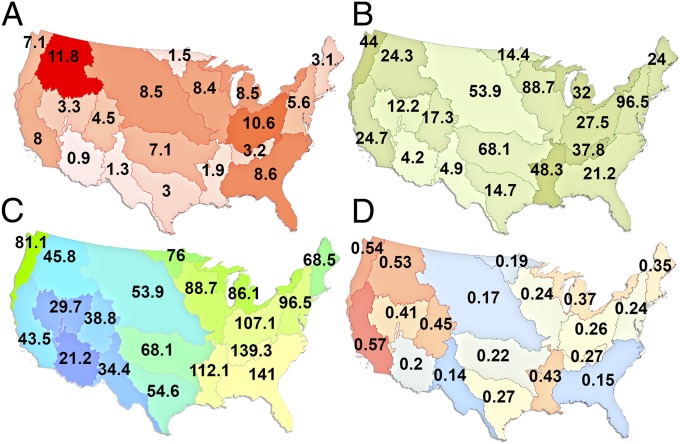
Fig. 1.
(A) Total aquatic carbon flux measured in TgC per year by modified two-digit HUCs. (B) Normalized aquatic carbon yields in gC per square meter per year per area of each HUC using Eq. 2. (C) Average NEP gC per square meter per year for the years 1990–2010 derived from the MsTMIP model outputs. (D) Maximum potential fraction of NEP accounted for by aquatic carbon if all aquatic carbon is derived from terrestrial sources [does not include (fa) from Eq. 2] represented as in B and C. Uncertainty ranges are presented in Table S5.

