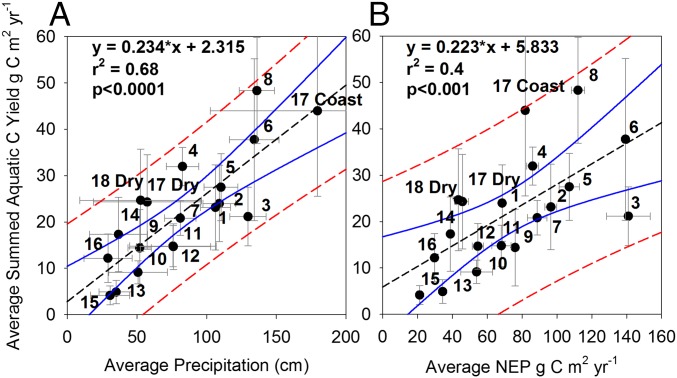
Fig. 2.
Correlation between the summed aquatic carbon yield (Eq. 2) and average annual precipitation (PRISM Climate Group, Oregon State University; prism.oregonstate.edu) (A) and NEP (MsTMIP model ensemble mean) (B) by HUC. Points are labeled by HUC. Red lines indicate the 95% prediction interval, and the blue lines represent the 95% confidence interval. Error bars represent the SD about the mean.

