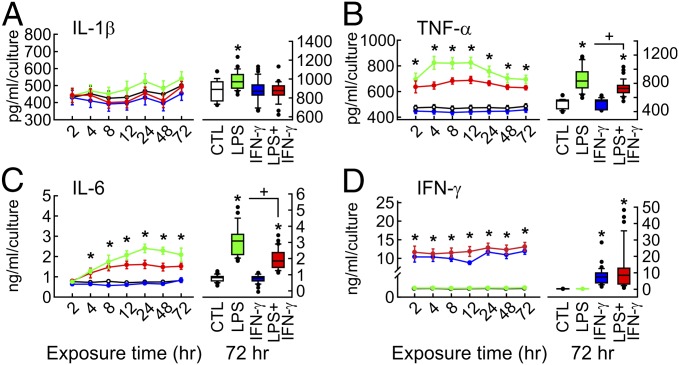
Fig. 1.
Cytokine release. Slice cultures were exposed to LPS (10 µg/mL), IFN-γ (100 ng/mL), or both (LPS+IFN-γ) at day in vitro 7 (SI Appendix, Fig. S1). (A–D) (Left) Profile of cytokine accumulation in the medium, normalized to the number of slice cultures per membrane. Dots and error bars represent mean ± SEM. *P < 0.001 of LPS and LPS+IFN-γ vs. CTL and IFN-γ, one-way ANOVA or ANOVA on ranks. For n/N membranes/preparations: CTL, 15/7; LPS, 19/7; IFN-γ, 21/7; LPS+IFN-γ, 19/7. (Right) Histograms of cytokine levels after 72 h of exposure. Boxplots: *P < 0.05, ANOVA on ranks vs. CTL; +P < 0.05, rank-sum test. CTL, 37/14; LPS, 34/12; IFN-γ, 33/11; LPS+IFN-γ, 37/12. IFN-γ levels most likely derive from the added protein. Control experiments are shown in SI Appendix, Fig. S2.

