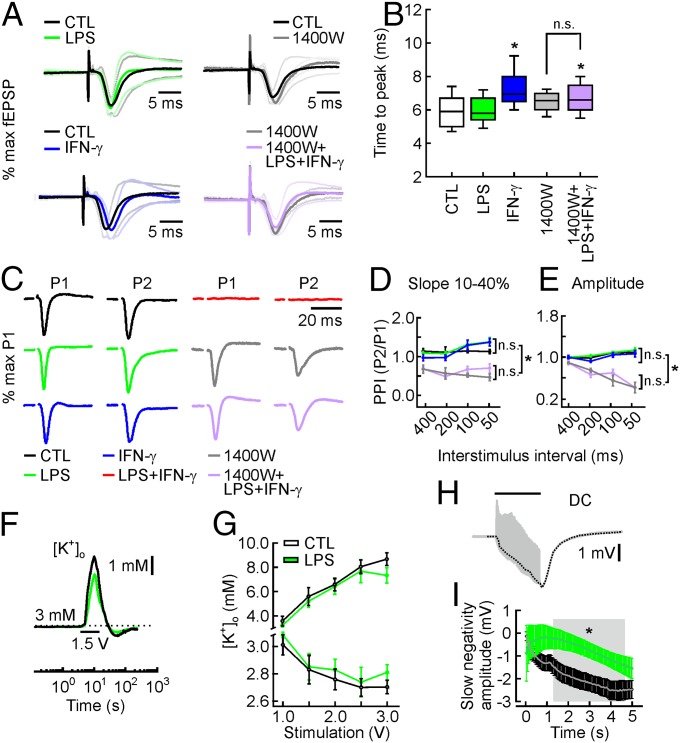
Fig. 4.
fEPSP kinetics, short-term synaptic plasticity, and K+ homeostasis. (A) fEPSP responses in CA3 plotted as normalized to their maximum amplitude to better appreciate the fEPSP kinetics. Solid lines represent grand averages of normalized fEPSP traces ± 1σ (dotted lines). (B) The time to peak between electrical stimulation and maximum fEPSP amplitude, describing the fEPSP kinetics. It is slower for IFN-γ and 1400W+LPS+IFN-γ, but unchanged when comparing 1400W and 1400W+LPS+IFN-γ. For n/N cultures/preparations: CTL, 78/9; LPS, 65/7; IFN-γ, 48/6; 1400W, 12/2; 1400W+LPS+IFN-γ, 80/3. *P < 0.05, ANOVA on ranks with Dunn´s post hoc pairwise test. n.s., nonsignificant. (C) fEPSP responses in CA3 evoked by paired-pulse stimulation at 50% of maximum response (stimulation artifacts truncated). Grand averages of paired-pulse fEPSP responses with an interstimulus interval (ISI) of 100 ms, normalized to the maximum amplitude as evoked by the first pulse. P1, first pulse; P2, second pulse. The paired-pulse index (PPI) is defined as the ratio P2/P1. (D and E) The PPI of 1400W+LPS+IFN-γ and 1400W is significantly lower compared with that of CTL, LPS, and IFN-γ for all ISIs. P < 0.05, ANOVA on ranks. There are no differences among CTL, LPS, and IFN-γ, or between 1400W+LPS+IFN-γ and 1400W. For n/N cultures/preparations: CTL, 23/9; LPS, 12/7; IFN-γ, 15/6; 1400W, 3/2; 1400W+LPS+IFN-γ, 14/3. P > 0.05, ANOVA on ranks. (F) Extracellular K+ homeostasis during electrical stimulation (5 s, 20 Hz, 1.5 V; black bar) of fiber tracts projecting to CA1. The double-barreled microelectrode ([K+]o and LFP) was positioned in stratum pyramidale of CA1. Increase, decay, and undershoot of [K+]o transients reflect K+ release from neurons, K+ (re)uptake from neurons and astrocytes, and K+ redistribution within the gap junction-coupled astrocytic syncytium, respectively. The traces illustrate average responses for control (black) and LPS exposure (10 µg/mL, for 72 h) (green). (G) Increase and undershoot of stimulus-induced [K+]o transients were similar for control and LPS. P > 0.05, rank-sum test. For n/N cultures/preparations: CTL, 15/10; LPS, 22/10. (H) Original LFP trace (gray) during stimulation (5 s, 20 Hz, 1.5 V; black bar) with filtered slow negativity (black dotted line). (I) Average slow DC-negativity during stimulation (5 s, 20 Hz). Gray area indicates period with significant differences. *P < 0.05, rank-sum test. n/N as in G.

