Fig. 5.
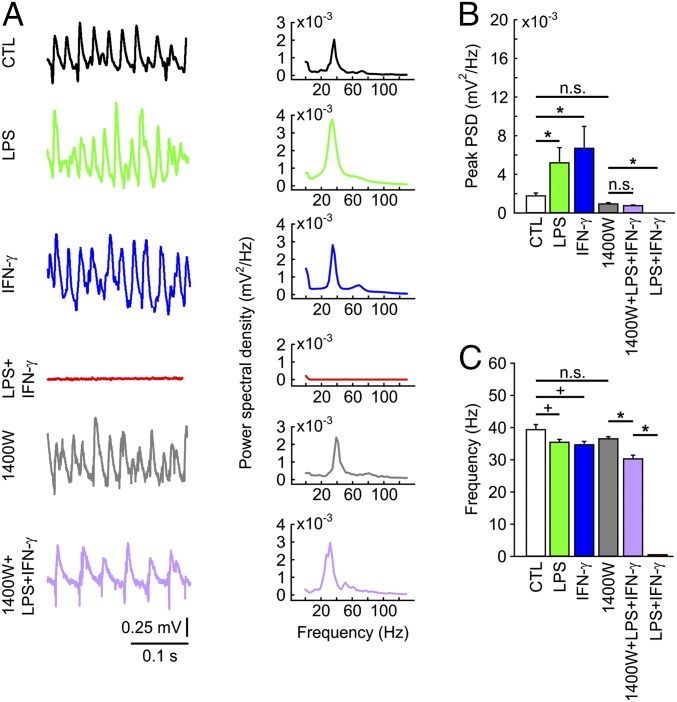
Fast network oscillations. (A) Gamma oscillations in stratum pyramidale of CA3 in the presence of acetylcholine (2 µM) and physostigmine (400 nM). LFP traces (Left) with corresponding power spectrograms for 10–130 Hz (Right). (B) Peak power spectral density derived from power spectrograms (A, Right). *P < 0.05, ANOVA on ranks. n.s., nonsignificant. (C) Peak frequency derived from power spectrograms (A, Right). *P < 0.05, ANOVA on ranks; +P < 0.05, rank-sum test. For n/N cultures/preparations: CTL, 12/5; LPS, 9/3; IFN-γ, 8/3; 1400W, 40/5; 1400W+LPS+IFN-γ, 33/5; LPS+IFN-γ, 10/3.

