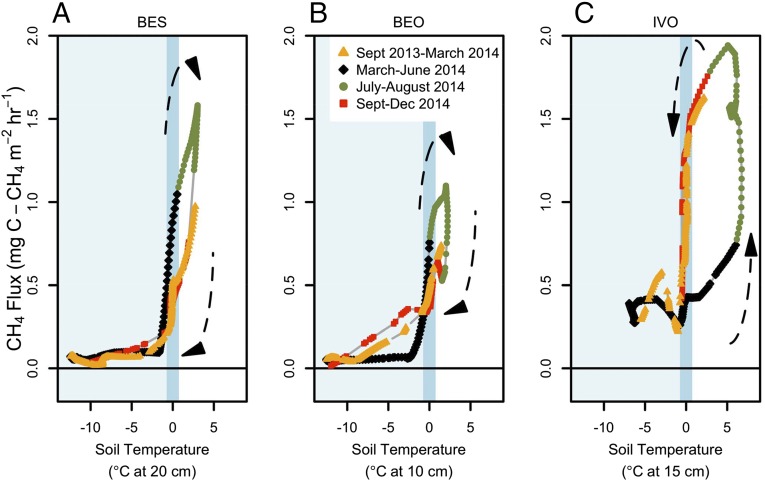
Fig. 3.
The methane flux variation with soil temperature on the North Slope of Alaska at Barrow-BES (BES) (A), Barrow-BEO (BEO) (B), and IVO (C) during the indicated periods. The zero curtain period is shaded in dark blue, with soil temperatures below −0.75 °C in lighter blue. The seasonal progression of each phase is indicated by the black arrows. Winter-time data are shown as orange triangles (September 1, 2013 to March 12, 2014) and red squares (September 1, 2014 to December 31, 2014). Data collected during the spring (March 13, 2014 to June, 30, 2014) are shown as black diamonds. Data during the summer period (July 1, 2014 to August 31, 2014) are shown as green circles.

