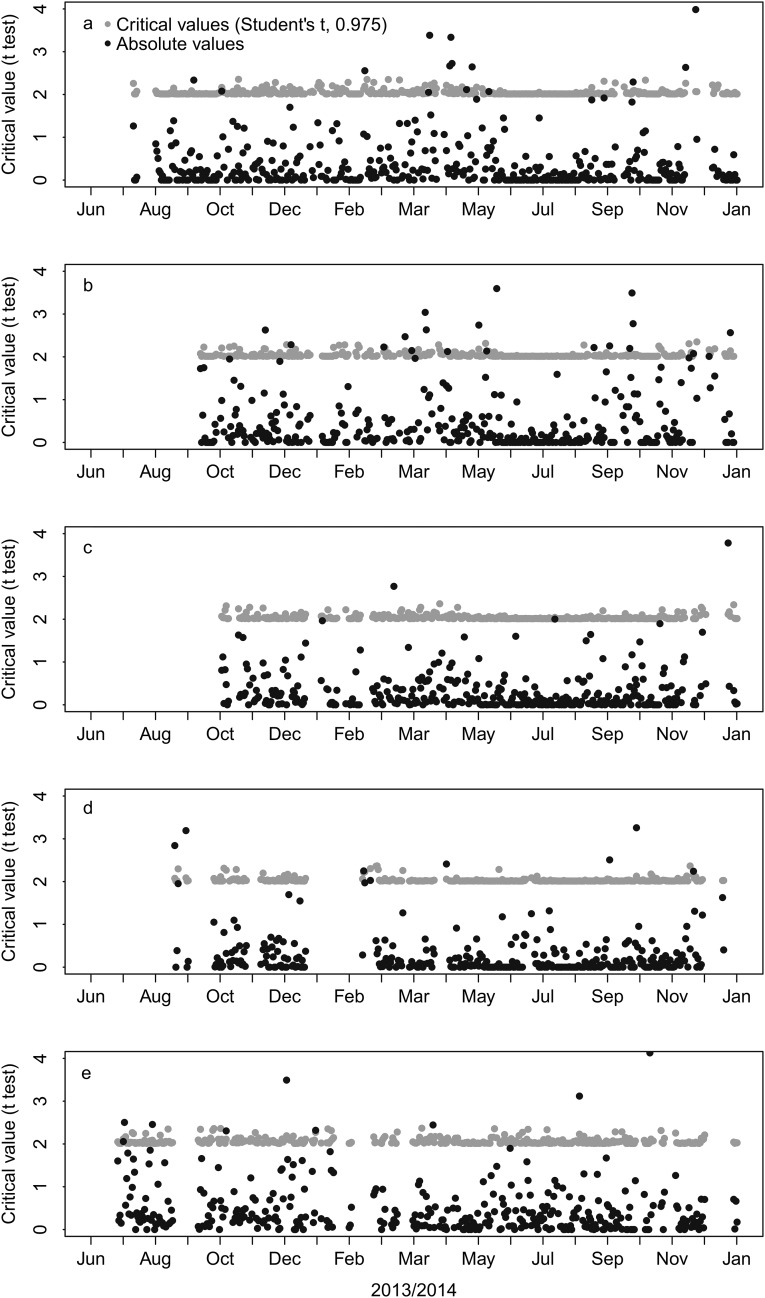
Fig. S7.
Critical values of the Student's t test distribution of the gap filling for all of the sites. We applied the critical values of the Student’s t test to each day where more than 6 h of data were available to investigate the influence of the gap filling on the daily averages of CH4 fluxes: BES (A), BEO (B), CMDL (C), ATQ (D), and IVO (E). Student’s t test values higher (black full circles) than the critical values of the Student’s t distribution (0.975 level) (gray full circles) represent days on which the gap filling of the data had an impact on the final daily average.

