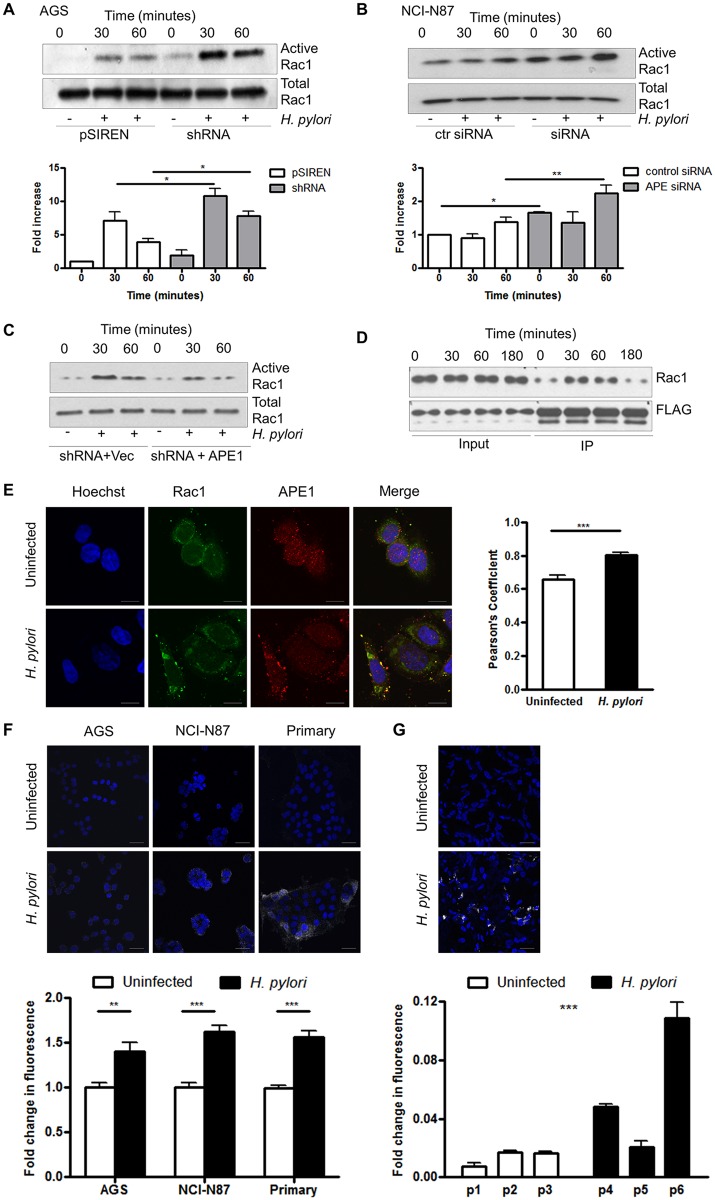
Fig 4. APE1 inhibits Rac1 activity and interacts with Rac1.
(A-B) pSIREN and shRNA cells were infected with H. pylori for 30 min or 1h or left uninfected and Rac1 activity was measured by detecting levels of GTP-bound Rac1 in AGS (A) and NCI-N87 (B) cells that were transfected with control siRNA or siRNA against APE1. Bar graphs in A and B show densitometry results. (C) shRNA cells either transfected with vector control or APE1 were infected with H. pylori and Rac1 activity was measured as in A. (D) AGS cells were transfected with either vector control or FLAG tagged APE1 and infected with H. pylori for 30, 60 or 180 min or left uninfected. FLAG was immunoprecipitated levels of bound Rac1 determined. (A-D) Representative western blots from three independent experiments are shown. (E) Representative confocal microscope images demonstrating co-localization of Rac1 and APE1. AGS cells were either left untreated (top panels) or treated with H. pylori for 1h (bottom panels). Cells were stained for nuclei (Hoechst), APE1 or Rac1. Yellow pixels demonstrated the co-localization of APE1 with Rac1 and scale bars indicate 10 μm. Results of the quantification by calculating Pearson’s coefficient are shown in the bar graph (F) APE1-Rac1 proximity was visualized using a proximity ligation assay (PLA). Each white spot represents APE1-Rac1 interaction in uninfected (top) and H. pylori infected (bottom) AGS cells, NCI-N87 cells and primary gastric epithelial cells. The nuclei were stained with DAPI (blue), scale bar indicate 20 μm. The bar graph below the microscopic images shows quantification of the interaction. (G) As in panel F, gastric biopsy specimens were analyzed using PLA. Biopsy specimens from one uninfected patient (p1) and one H. pylori infected patient (p6) are shown as examples. The bar graph shows show quantification of multiple images of three uninfected (p1–p3) and three H. pylori infected (p4–p6) biopsy specimens obtained from different individuals. Statistical test shows the difference in PLA signal between the patient groups. The nuclei were stained with DAPI (blue), scale bar indicate 20 μm. Levels of significance are indicated as follows: * p<0.05, ** p<0.01 and *** p< 0.001.

