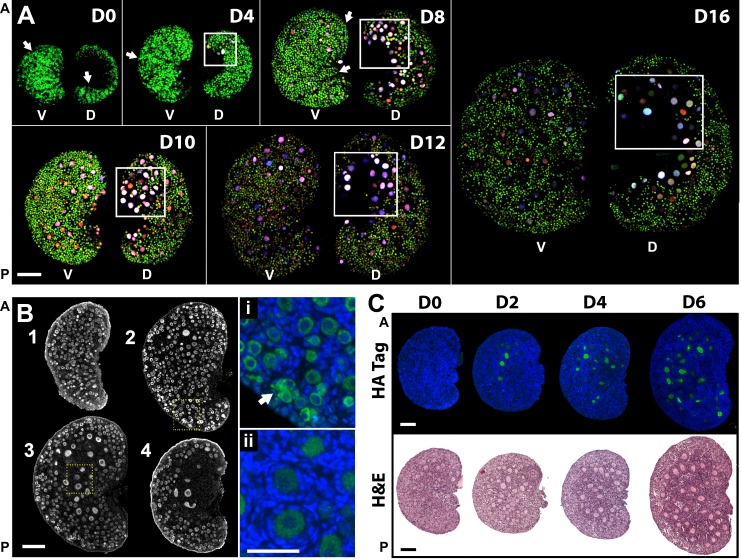
FIG. 4.
Differential follicle development in ventral and dorsal ovarian regions is conserved throughout the prepubertal period. A) Maximum projection of confocal z-stack images revealed different oocyte populations on the surface of the two ovarian regions. Boxes highlight regions with elevated number of growing follicles (anterior-dorsal). Arrows exemplify follicle distribution resembling cord-like structures. The same imaging settings were used except Day 0 and Day 4, which required lower laser power for EGFP detection. Ventral (V) and dorsal (D) regions of the same ovary, rotated horizontally, are shown. Scale bars are approximated because images represent three-dimensional projections; n = 5 for each time point. Bar = ∼200 μm. B) Geographic differences in follicle development in the same ovary. Immunofluorescence assay with MVH antibody in a 4-day-old mouse ovary in serial sections 45 μm apart (n = 6). Arrow shows region where ovarian nest remains. Highlighted areas are expanded on i and ii. 1, ventral; 4, dorsal. Green, MVH; blue, DAPI. Bar = 100 μm and 50 μm (i and ii). C) Gradual expansion of the ovarian region containing growing follicles; n = 6–10 for each represented time point. Green, HA tag; blue, DAPI; H&E, hematoxylin and eosin staining. A, anterior; P, posterior. Bar = 100 μm.

