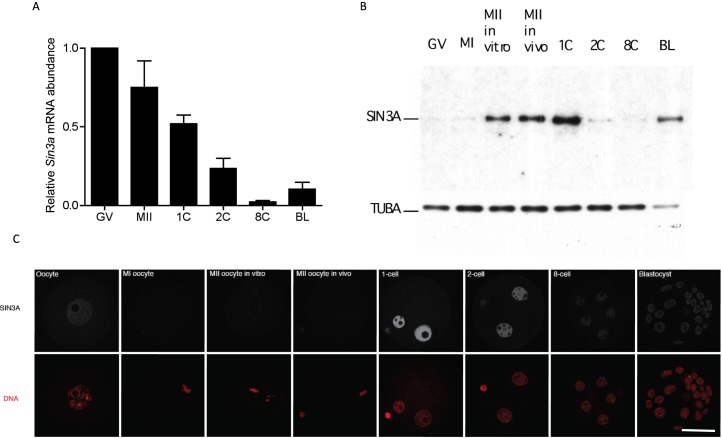
FIG. 1.
Developmental expression profile of Sin3a/SIN3A. A) Sin3a mRNA levels were measured by qRT-PCR at the indicated stages. Data were normalized against the detected levels of exogenously added GFP and expressed relative to the value obtained for mid-1-cell embryos. The experiment was conducted three times, and the data are expressed as mean ± SEM. GV, full-grown GV-intact oocytes; MII, metaphase II-arrested egg; 1C, 2C, and 8C refer to 1-cell, 2-cell, and 8-cell stages, respectively; BL, blastocyst. B) The relative amount of SIN3A was measured by immunoblot analysis. MII in vitro, oocytes were matured in vitro to MII; MII in vivo, MII eggs were collected following maturation in vivo. The TUBA signal was used to normalize total protein loading. The experiment was performed three times, and similar results were obtained in each case; shown is a representative example. C) Immunocytochemical analysis of SIN3A expression during preimplantation development. The experiment was conducted twice, and at least 15 oocytes/embryos were analyzed for each experiment. Bar = 50 μm.

