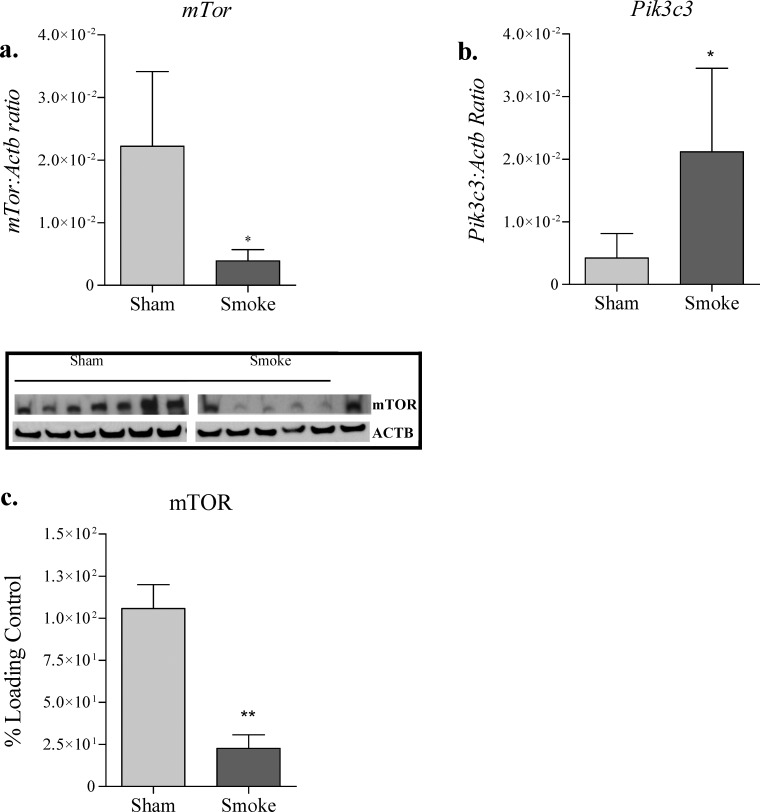
FIG. 3.
Changes in mTor gene (a), Pik3c3 gene (b), and mTOR protein (c) expression following 8 wk of exposure to cigarette smoke. Analysis of mTor and Pik3c3 gene and mTOR protein expression was performed on whole-ovarian homogenates from sham and smoke-exposed mice. a and b) qPCR gene expression changes relative to the Actb control (n = 6 per group). c) Representative immunoblot showing protein expression changes relative to the ACTB loading control (n = 7 sham and 6 smoke). Data were checked for normality and equal variance, and treatment effects were tested using t-test. Values are expressed as mean ± SEM. *P < 0.05 and ** P < 0.01.

