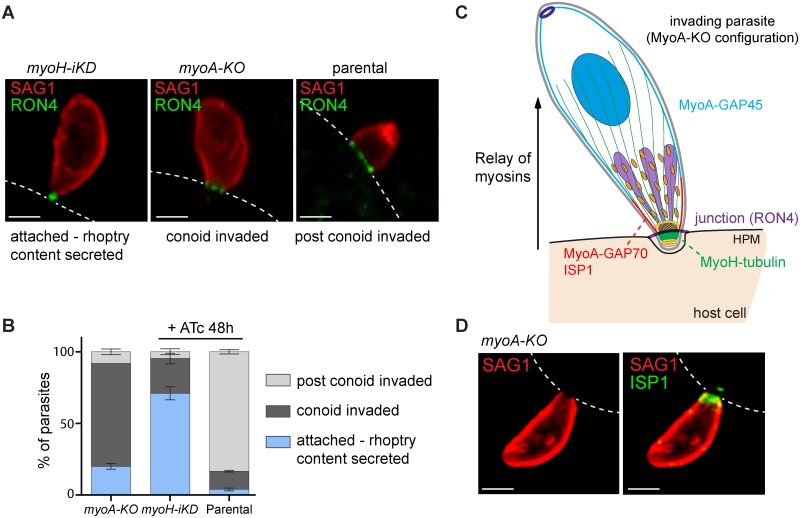
Fig 6. T. gondii myosin H is part of a conoidal glideosome and triggers the first step of invasion.
(A) Invasion pulse of 7 min using myoH-iKD + 48 h ATc, myoA-KO and a parental strain. The surface antigen 1 (SAG1) and the rhoptry neck secreted protein (RON4) were used to visualize respectively the parasite surface and the circular junction formed by invading parasites. The host cell plasma membrane is illustrated by dashed white lines. Depletion of MyoH blocked most of the parasites at the attachment step, prior to circular junction translocation (RON4 is detectable as a dot). The myoA-KO are blocked predominantly during conoid penetration, probably at the IMC level (RON4 is visible as a ring below the conoid). Most of the parental parasites completed penetration but some of them were captured at any step of the entry process (RON4 is detectable as ring at various position along the parasite). Scale bar 1 μm. (B) Quantification of the invasion pulse described in (a). Parasites were scored as attached, conoid invaded up to the IMC or post conoid invaded. Results are expressed as mean ± SD. (C) Schematic representation of the MyoH and MyoA relay at the conoid–IMC interface delineated by ISP1 (IMC sub-compartment protein 1). The scheme represents a parasite in the myoA-KO situation as described in (a). HPM: host plasma membrane. (D) Co-localization of SAG1 with the apical cap marker ISP1 after pulse invasion in the myoA-KO cell line. Scale bar 2 μm.

