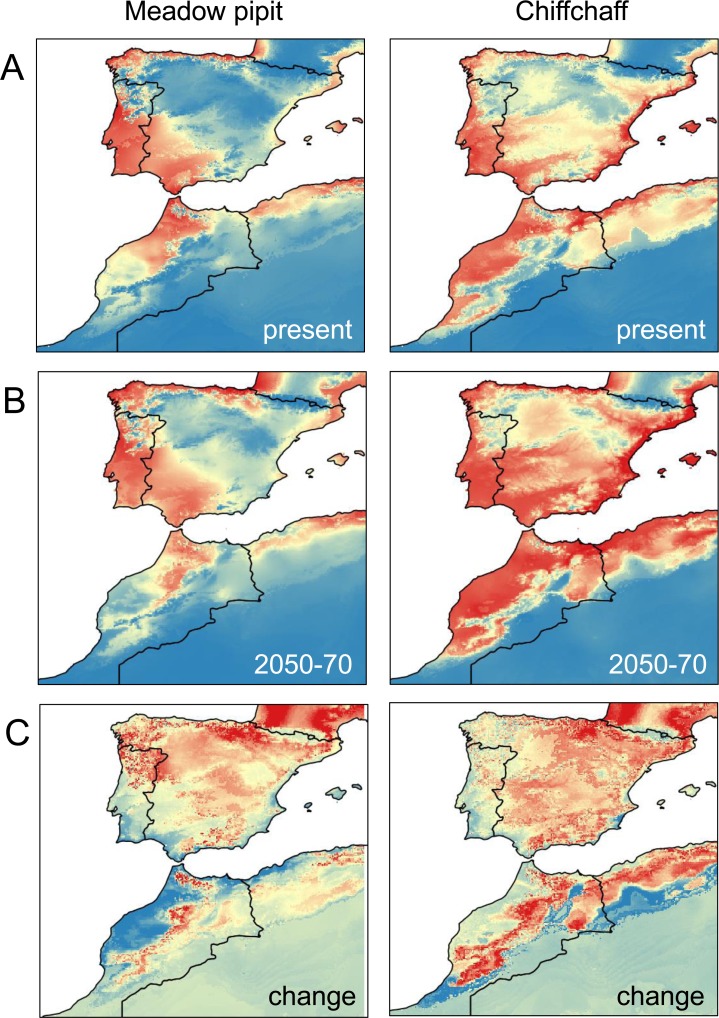
Fig 4. Trends of climate suitability.
A. Distribution of high (red), medium (yellow) and low (blue) climate suitability sectors for the meadow pipit and the chiffchaff according to similar occurrence probability intervals. B. Mean predicted distributions for the period 2050–2070. C. Change in climate suitability from present to 2050–2070. Blue color represents decrease and yellow to red represent increasing rates of climate suitability.

