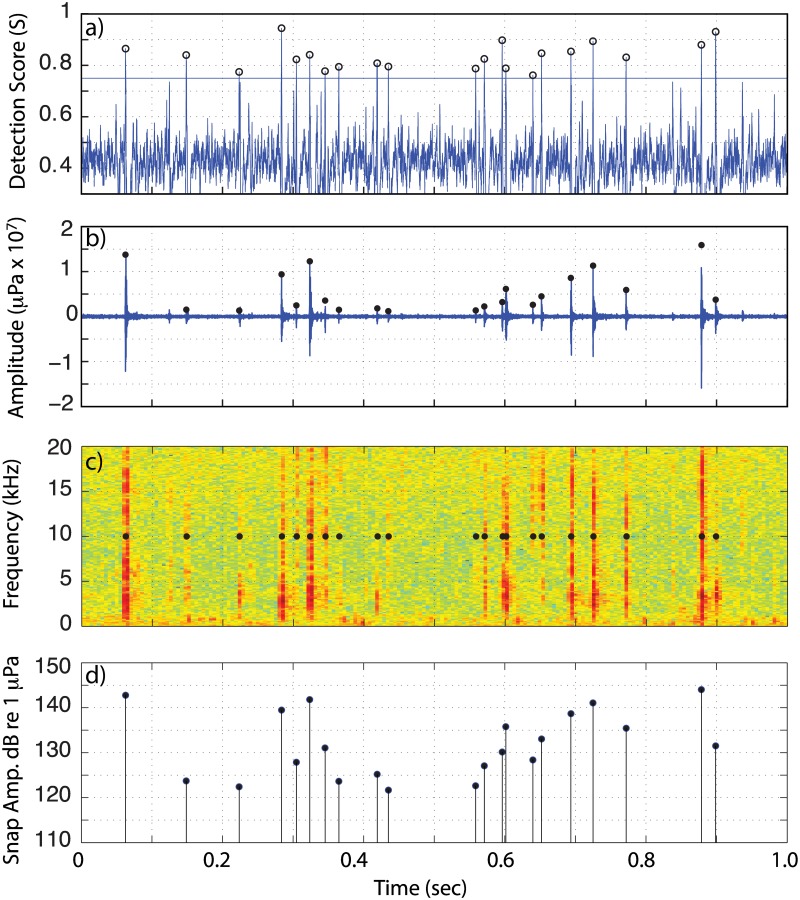
Fig 3. Snap detection example.
An example of the detection score procedure applied to the West Bay acoustic data. Circles demote detections with a score S ≥ 0.75 and peak-to-peak amplitude ≥ 120 dB 1 μPa @ 1 m. a) detection score, b) pressure waveform, c) spectrogram, and d) peak-to-peak snap received level.

