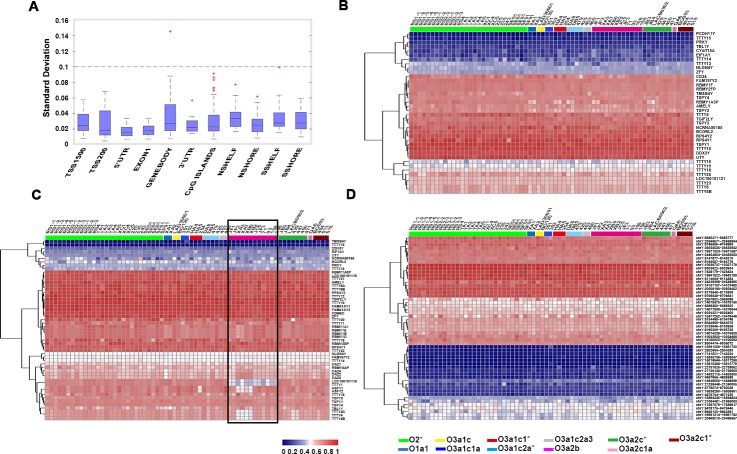
Fig 5. The methylation pattern of functional regions on the Y chromosome.
A) Box plots showing the standard deviation of methylation level within each region. The median line indicates the average methylation level, the edges represent the 25th/75th percentile, and the whiskers represent the 2.5th/97.5th percentile. B−D). Heat map showing the methylation levels of 38 detected TSS1500 regions (B), 53 gene body regions (C), and 55 CpG island regions (D).

