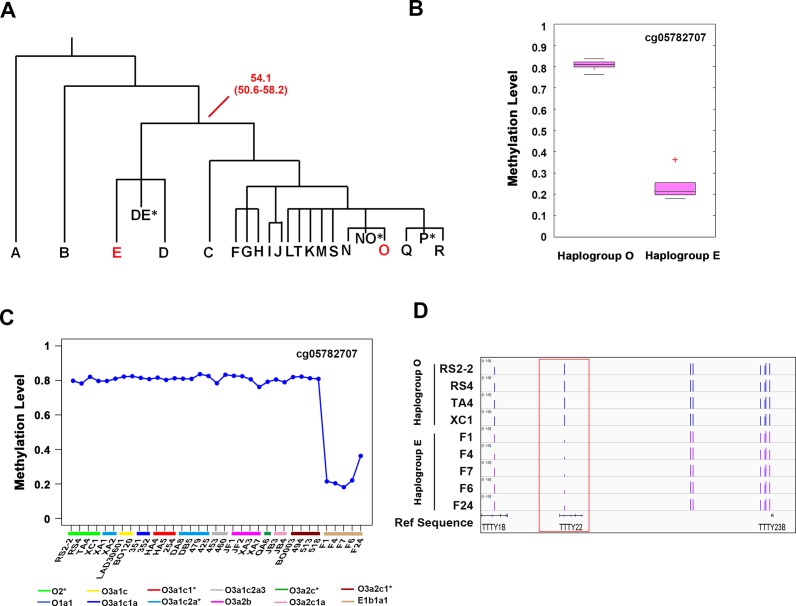
Fig 6. The different methylation site in haplogroup E1b1a1 samples.
A) The Y chromosome phylogenetic tree showing the coalescence time between haplogroup E and haplogroup O. Numbers in red indicate the coalescence time (in years) and 95% confidence interval of the node. B) Box plots showing the methylation level of haplogroup E1b1a1-specific methylation site. **P < 0.01. C) The methylation level of cg05782707 among all samples. Each data point represents the β-value of each sample. D) The genomic location of cg05782707 site.

