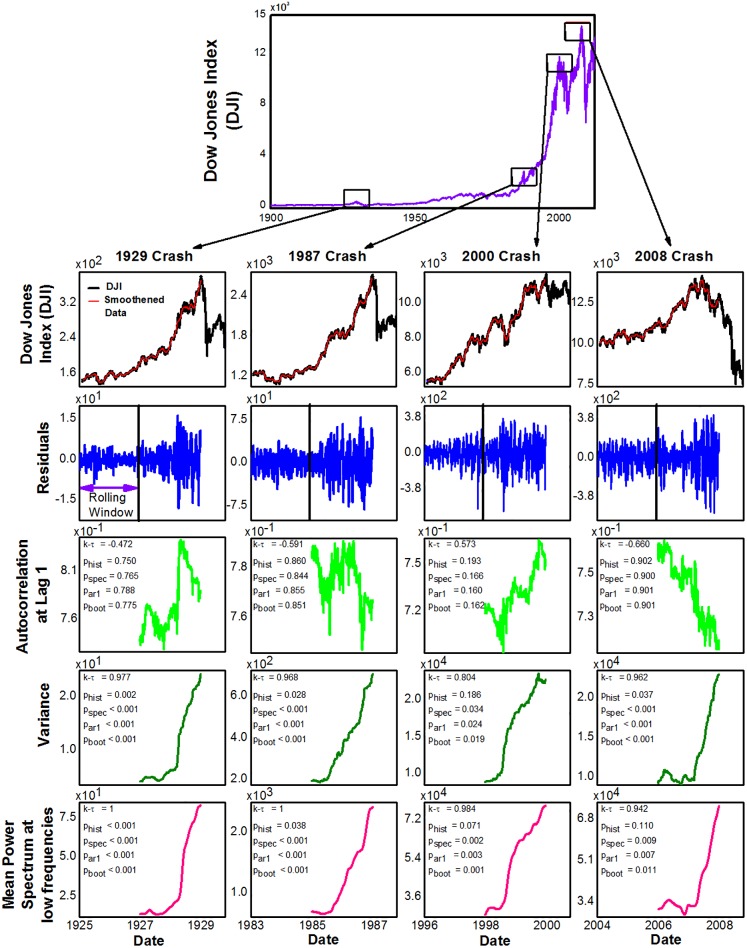
Fig 1. Early warning signals of major financial crashes of Dow Jones Index (DJI).
The columns correspond to analysis of each crash. The solid vertical line together with the arrow in the residual plots, which were obtained after detrending the data, shows the length of the rolling window (lrw) over which all indicators are estimated. The symbol k-τ represents Kendall’s rank correlation coefficient estimated for each indicator for 250 days prior to the crash. The p-value denoted by phist quantifies how likely such trends are in years far away from the crash. The other three p-values quantify likelihood of such trends occurring by chance (Methods B). Parameters: lrw = 500 days, bw = 25, lkw = 250 days, lKend = 0 days.

