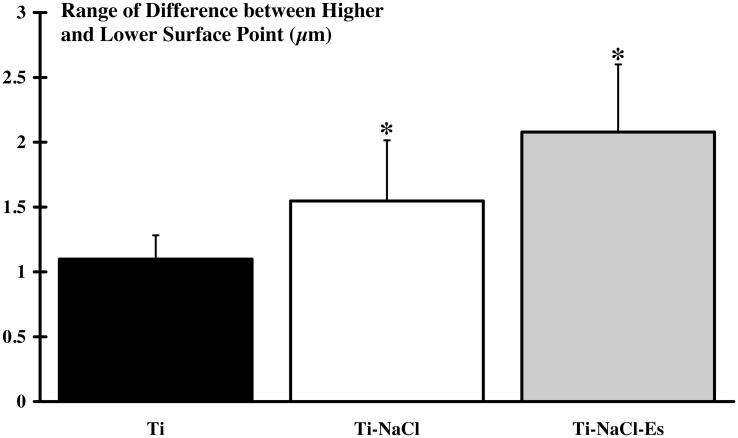
Fig 4. Surface degradation of the implant.
The surface of the implant is scanned before and 3 weeks after implantation and the range between higher and lower surface point is measured. Results indicate that the Ti-NaCl (implanted and submitted to high-salt diet) and Ti-NaCl-Es (implanted and simultaneously submitted to high-salt diet and NEMS program) groups present a significant higher (*: p<0.05) degradation of implant compared to Ti (non submitted to high-salt diet and NEMS program) group.

