FIG. 5.
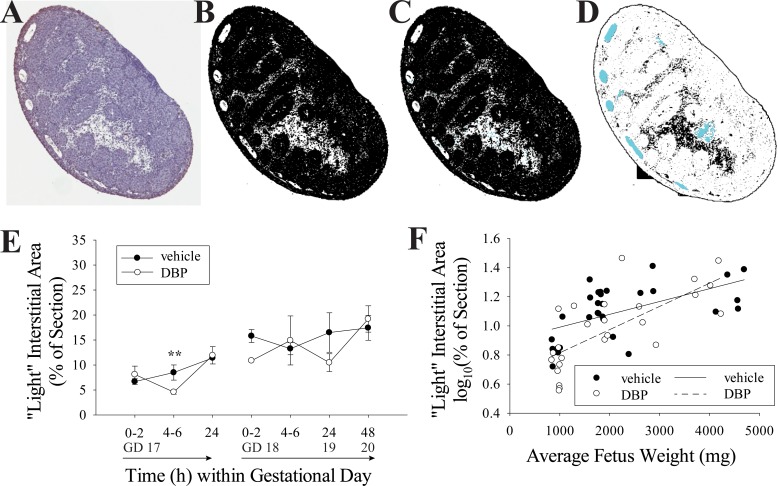
The low-cell-density interstitial area in the testis increases with gestational age. A–D) The conversion of a whole-mounted testis section stained with TUNEL assay and hematoxylin counterstain (A) to a binary black-and-white image where the white area largely represents low-cell-density interstitial area (B). In C, the nuclear area within the interstitium (blue) is identified and added to the interstitial total area. In D, blood vessel area (blue), which also appears as white in the binary images, is subtracted from the interstitial area. GD 17 data but not GD 18 were not normally distributed. To correct for this, GD 18 data were log10 transformed, and then data were analyzed by two-way ANOVA followed by the Holm-Sidak test. The light-colored, low-cell-density interstitial area in the cross sections did not differ significantly by treatment group when GD 18 data were analyzed by two-way ANOVA (D); however, at 4–6 h of treatment beginning on GD 17, the log10-transformed interstitial area was greater in vehicle- than DBP-treated samples (**P = 0.005). Values in E are mean ± SEM. For regression analysis, all data were log10 transformed to correct for nonnormal distribution. Log10-transformed interstitial area, as percent of the section, slightly increased with fetus weight in both vehicle- (n = 30, R2 = 0.3162, P = 0.0012) and DBP-treated (n = 25, R2 = 0.5145, P < 0.0001) groups (F).

