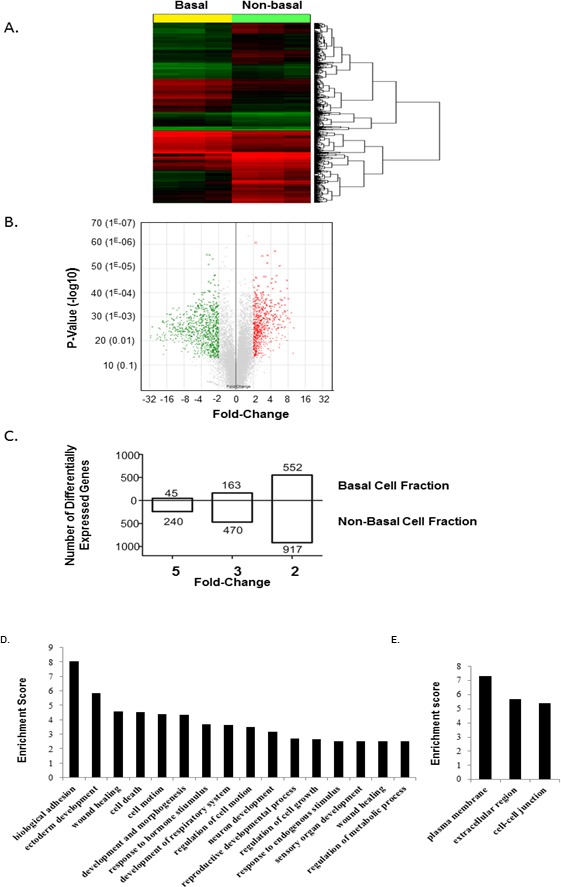
FIG. 3.

Identification of basal cell fraction-enriched transcripts. A) Heat map and hierarchical cluster analysis of genes expressed in the basal cell fraction (n = 3) compared to nonbasal cell fraction (n = 3). Genes expressed at levels above the average are represented in red, below average in green, and average in black. B) Volcano plot comparing the transcriptome of cells in the basal cell fraction (n = 3) and nonbasal cell fraction (n = 3). Red dots correspond to significantly up-regulated probe sets in basal cells (fold-change ≥ 2 with a p-value ≤ 0.05); green dots represent significantly down-regulated probe sets in basal cells (fold-change ≥ 2 with a P value ≤ 0.05); gray dots represent nonsignificant gene probe sets. C) Number of genes that are significantly differentially expressed by 2-, 4-, and 5-fold in the basal cell fraction compared to the nonbasal cell fraction. D) Differentially expressed genes in the isolated basal cell fraction and nonbasal cell fraction of the epididymis. Genes were grouped according to predicted biological function using the DAVID application software. Enrichment score calculations were based on Expression Analysis Systematic Explorer (EASE) score. Genes were considered differentially expressed when the difference was greater than 2-fold. D) Genes grouped according to their biological processes. E) Genes grouped according to the cellular components.
