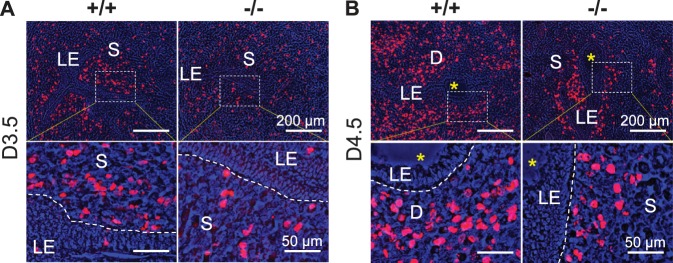
FIG. 2.
BrdU labeling of cell proliferation on D3.5 and D4.5 Lpar3+/+ (+/+) and Lpar3−/− (−/−) endometrium. A) Representative images from D3.5 uteri. n = 4–6. B) Representative images from D4.5 uteri. n = 3. Red, BrdU labeling; blue, brightfield image merged in blue channel; rectangle, area enlarged in bottom panel; S, stroma; D, decidual zone; yellow star, embryo; dotted line on the bottom panel, border between LE and stroma. Bars = 200 μm (top panel) and 50 μm (bottom panel).

