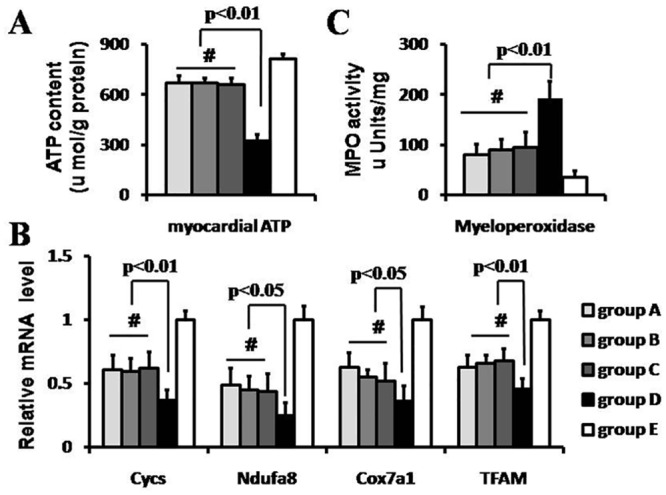
Fig 3. Mitochondrial function and inflammation reaction.

The myocardial ATP level (A) and mitochondrial function gene expression levels (B) were also detected. The myocardial ATP level was higher in RIPoC+IPoC, RIPoC and IPoC group than that in IR group (p<0.01). The mRNA expression levels of Cycs, Ndufa8, Cox7a1 and TFAM were significantly regulated up in RIPoC+IPoC, RIPoC and IPoC group than that in IR group. The myeloperoxidase(MPO) assay, which indexed inflammation reaction, also determined(C). The MPO level was lower in RIPoC+IPoC, RIPoC and IPoC group than that in IR group (p<0.01). Group A: RIPoC+IPoC group, received the combined algorithms of RIPoC and IPoC; Group B: RIPoC group, which received 3 cycles of 30 seconds reperfusion and re-occlusion on the limb at the onset of reperfusion; Group C: IPoC group, received 3 cycles of 30 seconds reperfusion and re-occlusion on the LAD; Group D: IR group, received reperfusion without interruption after ischemia; Group E: sham group, received only open chest.
