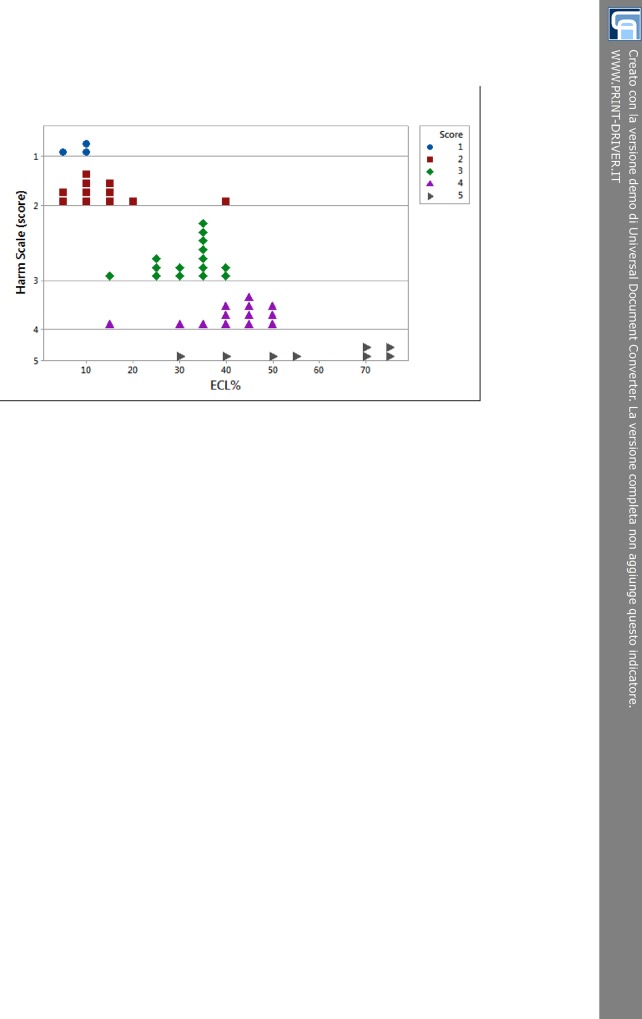
Fig 1. Dotplot of distribution of endothelial cell loss percent within the 5 levels of the harm scale.
There are 3 patients in level 1 (blu circle dots), 11 in 2 (red square dots), 15 in 3 (green rhombus dots), 13 in 4 (purple triangle dots), and 8 in 5 (grey right arrow dots). ECL = endothelial cell loss.

