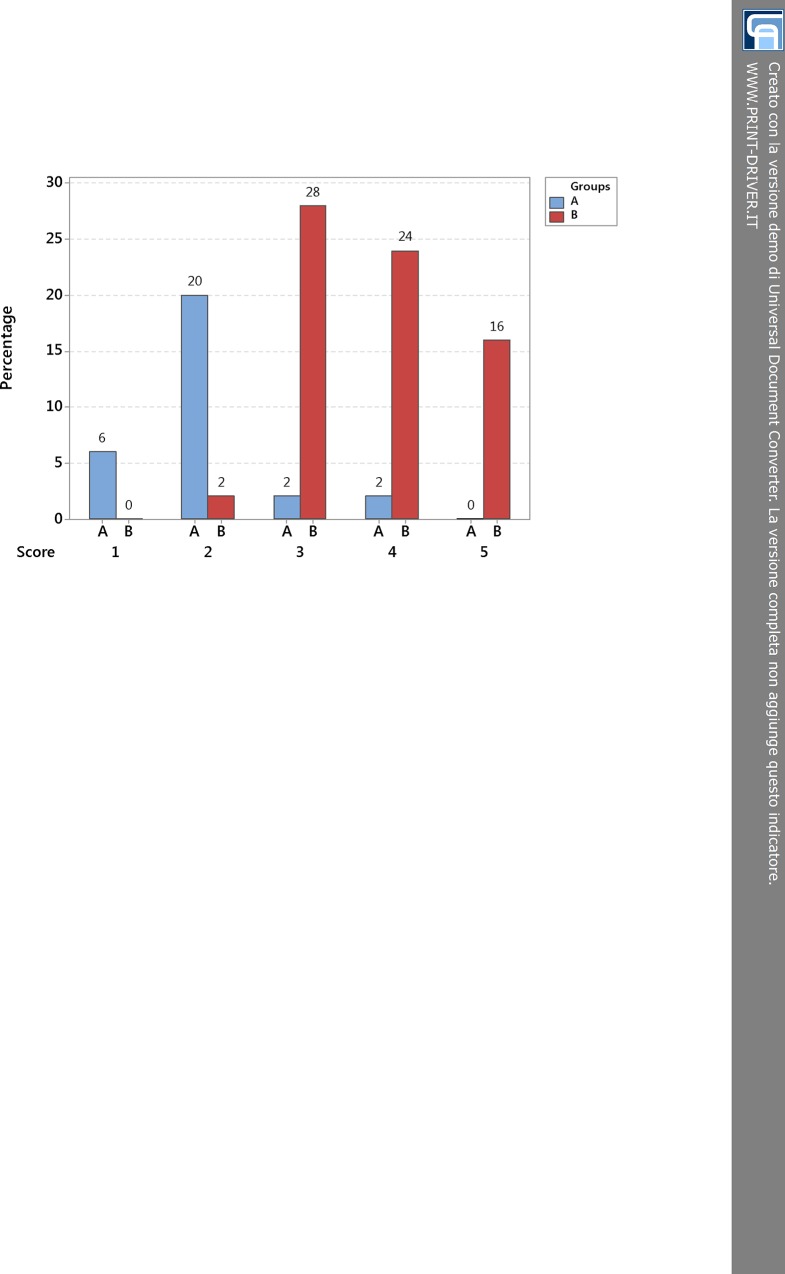
Fig 5. Bar chart compares group A (ECL < 20%) and B (ECL ≥ 20%) for each level of the 5-score harm scale.
The cut-off value of ECL = 20% results from Tukey post-hoc test, which states a distinction between scores 1–2 and 3-4-5 (see 95% confidence interval in Fig 2). For rising scores, there is a boost in percentage of people of group B and a relevant drop in percentage of people of group A. ECL = endothelial cell loss.

