
Figure 4.
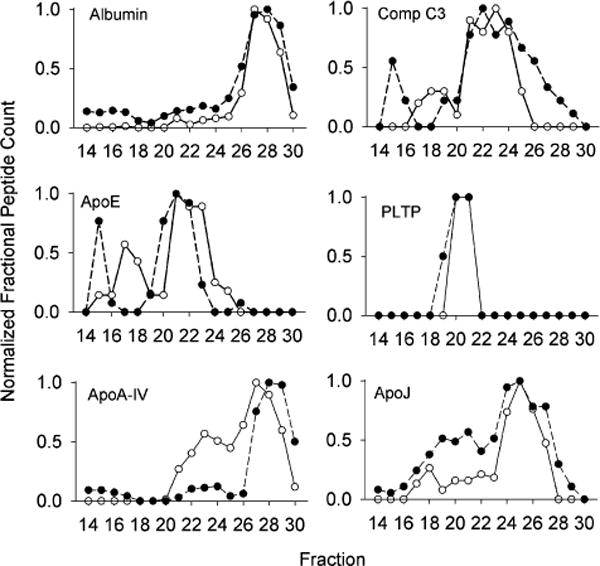
Examples of identified proteins that do not exhibit a noticeable difference in elution profile between mouse and human. The normalized peptide counts (determined as in Figure 3) for the indicated protein across each fraction are shown. For all figures, WT mouse data is represented by open circles and human data is shown in closed circles. Data represents a mean peptide count from 6 mice or 3 humans.