
Figure 2.
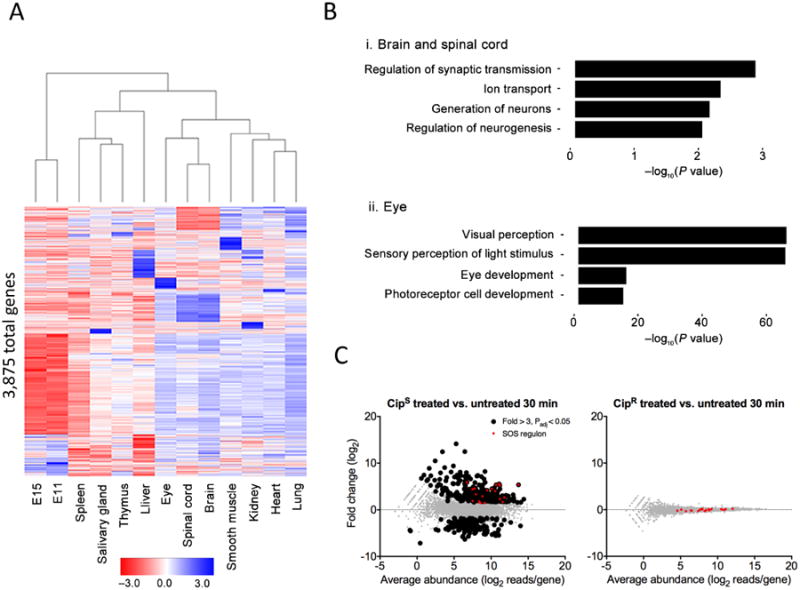
Differential gene expression analysis using RNAtag-Seq. (a) Heat map of all 3,875 differentially expressed genes (fold change >2, Padj < 0.01 with Padj corresponding to the P value adjusted for multiple testing using the Benjamini-Hochberg procedure) across adult mouse tissues and mouse embryos at developmental stages E11 and E15. (b) Selected Gene Ontology categories and their enrichment for specific tissues: brain and spinal cord samples (top) and eye samples (bottom) relative to all samples. The enrichment is plotted as the −log10 of the enrichment P value. (c) MA plots of 2 ciprofloxacin-susceptible (CipS, left) and 2 ciprofloxacin-resistant (CipR, right) E. coli clinical isolates 30 min after exposure to ciprofloxacin versus untreated. Genes found to be significantly up- and downregulated (greater than threefold, Padj < 0.05) by RNAtag-Seq are colored black. Genes in the SOS regulon are colored red.