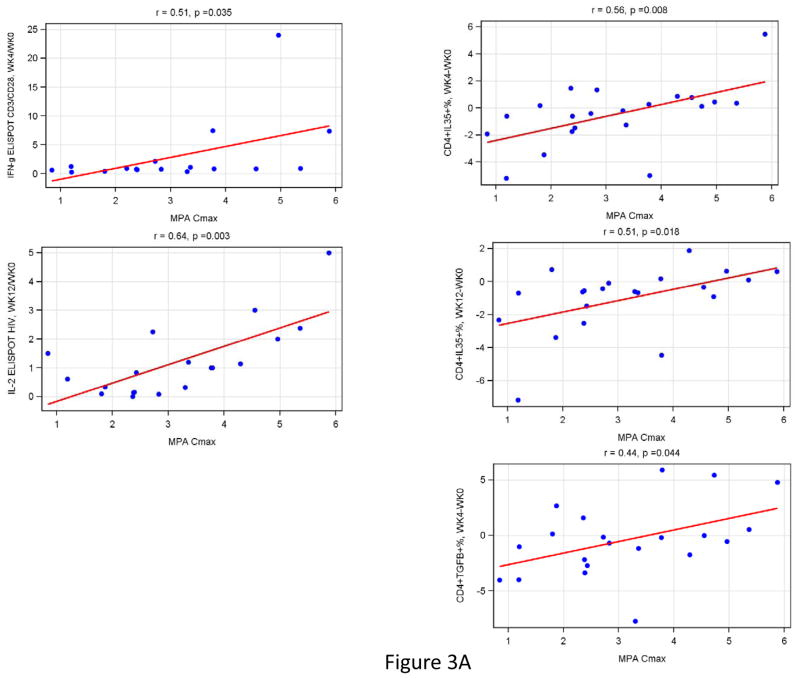
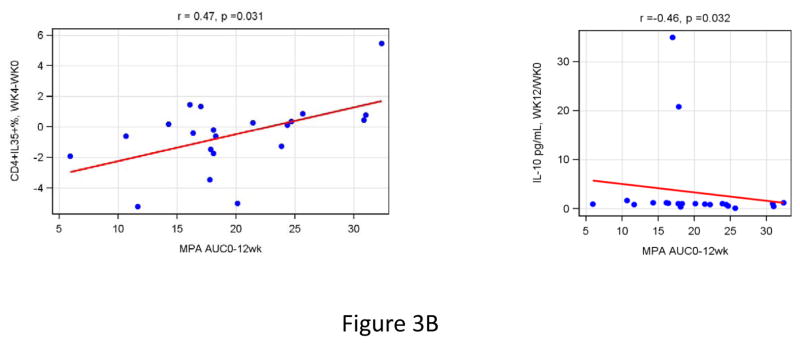
Figure 3. Effect of the magnitude of MPA Cmax (Panel A) and T-cell subsets (Panel B) on CMI, T-cell subsets and soluble cytokines in HIV-Infected women.
Data were derived from 24 HIV-infected women who received a single dose of DMPA. MPA Cmax was measured at week 4 and AUC at week 12 after DMPA administration. Correlation analyses were performed between changes from baseline to week 4 or 12 of all the measures of CMI, T-cell subsets and soluble cytokines evaluated in this study. The graphs show only the significant correlations. Estimated linear regression lines, correlation coefficients (r) and p values calculated using Spearman’s correlation test are shown on each graph.


