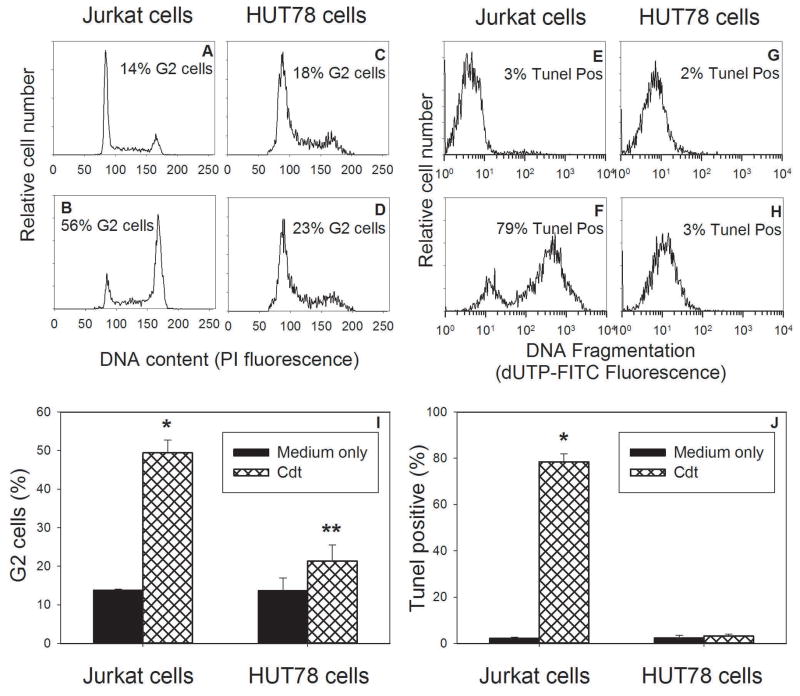
Figure 1.
Comparison of the effects of Cdt on toxicity in Jurkat and HUT78 cells. Jurkat cells were treated with medium alone (panel A) or Cdt (2.0 pg/ml) for 16–20 hr and cell cycle distribution determined following staining with propidium iodide (PI) and analysis by flow cytometry. Panels C and D show HUT78 cells in the presence of medium alone or Cdt, respectively. In addition to cell cycle, the effects of Cdt on apoptosis was assessed using the TUNEL assay; Panels E and F show the results from Jurkat cells in the presence of medium and Cdt (25 pg/ml), respectively, 48 hr after exposure to toxin. Results with HUT78 cells are shown in panels G (medium only) and H (Cdt). Numbers in each panel represent the percentage of G2 cells or apoptotic cells. Panels I and J show the aggregate results from three experiments each performed in duplicate; *indicate P<0.05 when compared to control Jurkat cells and ** indicates P<0.05 when compared to Cdt-treated Jurkat cells.

