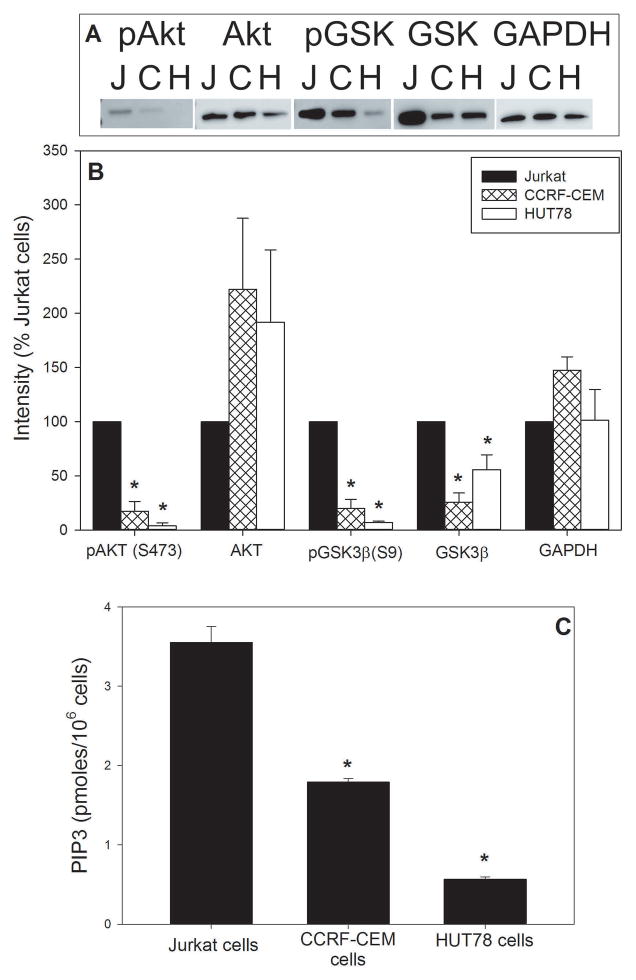
Figure 2.
Baseline analysis of components of the PI-3K signaling pathway. Panel A shows a representative Western blot for pAkt, Akt, pGSK3β (pGSK), GSK3β (GSK) and GAPDH for Jurkat cells, CCRM-CEM cells and HUT78 cells. Panel B shows the aggregate results for three experiments; results are expressed as a percentage of Jurkat cell density. Panel C shows the results of PIP3 levels and represent the mean SEM. *indicate P<0.05 when compared to control Jurkat cells

