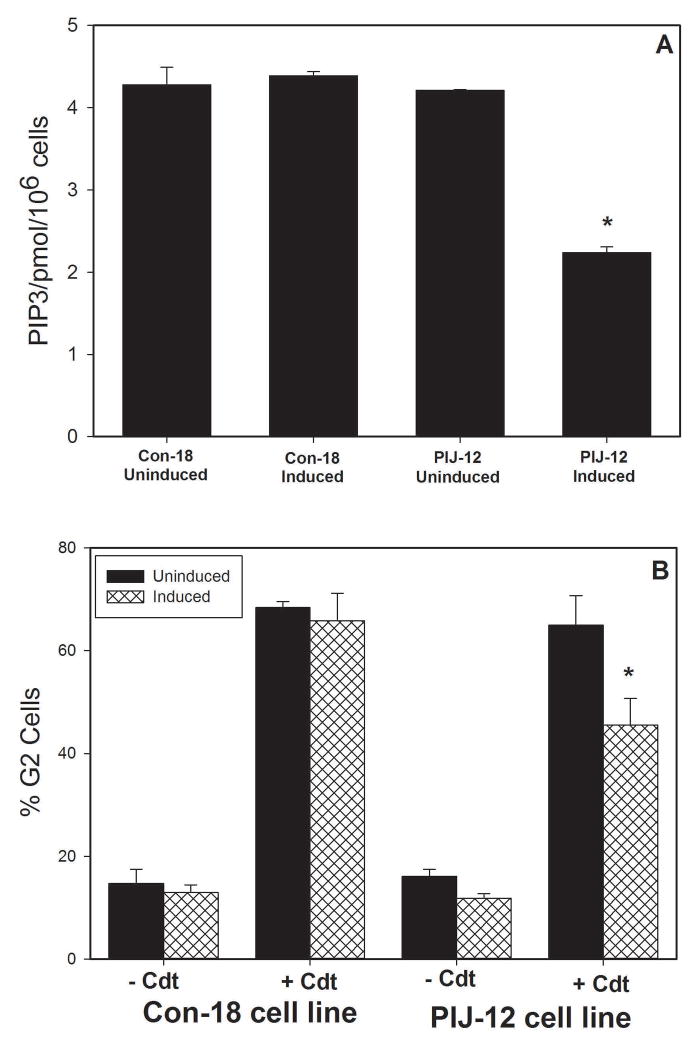
Figure 3.
Analysis of Jurkat cells reconstituted with PTEN. Panel A shows the baseline PIP3 levels were measured in Jurkat cells reconstituted with PTEN: controls (Con18) and pten transfection (PIJ-12); these cells were assessed under non-induced and induced conditions. Values are pmol PIP3/106 cells and represent the mean ± SEM of three replicate experiments; *indicate P<0.05 when compared to uninduced cells treated with Cdt. Panel B shows the effect of Cdt holotoxin on PIJ-12 and Con 18 cell lines which were treated with doxycycline as well as cells maintained under non-induced conditions. The percentage of G2 cells is plotted versus Cdt concentration. The mean ± SEM is shown for three experiments; *indicate P<0.05 when compared touninduced cells treated with Cdt.

