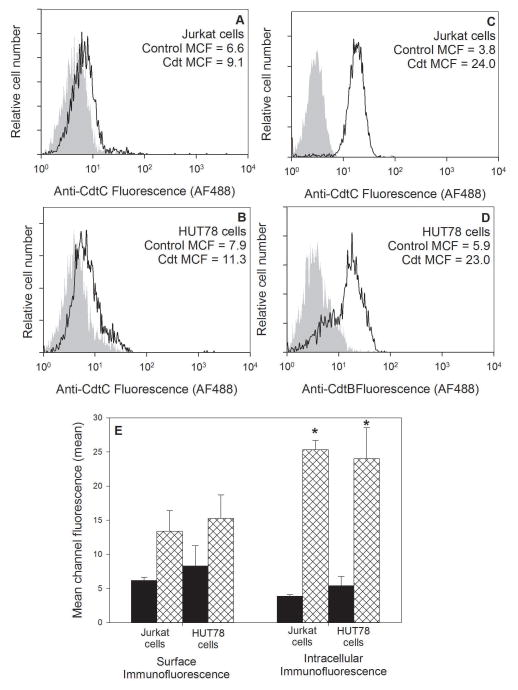
Figure 4.
Flow cytometric analysis of the binding of Cdt holotoxin and internalization of CdtB in Jurkat cells and HUT78 cells. Jurkat cells (panels A and B) and HUT78 cells (panels C and D) were exposed to medium (panels A and C) or Cdt (panels B and D). Cells were then stained for surface association of Cdt holotoxin (anti-CdtC mAb) or internalization of CdtB (anti-CdtB mAb). The mean channel fluorescence (MCF) is indicated in each panel for both control cells not exposed to Cdt (grey curve) and toxin treated cells (black line). The mean MCF ± SEM for three experiments is shown in panel E; *indicate P<0.05 when compared to control cells.

