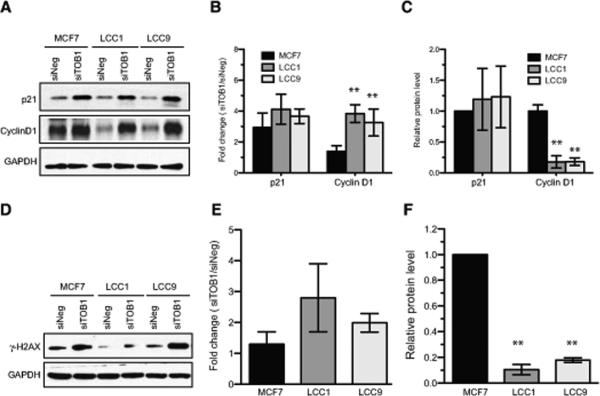
Figure 4. TOB1-dependent molecular signaling changes.
A-C. Induction of p21 and Cyclin D1 following TOB1 knockdown. siNEG or siTOB1 were transfected in MCF7, LCC1 or LCC9 cell lines. A. Western blot analysis was performed 48 hours later to determine protein levels. B. Fold increase of TOB1 knockdown-induced protein level was quantitated and plotted. Data are representative of at least 3 independent experiments and shown as mean values +/− S.D. ** p<0.01 vs. MCF7. C. Basal level of p21 and Cyclin D1 in MCF7, LCC1 and LCC9 cells. ** p<0.01 vs. MCF7. D-F DNA damage (phosphorylation of histone H2AX at Serine 139, γ-H2AX) induced by TOB1 knockdown. siNEG or siTOB1 were transfected into 3 cell lines for 48 h. Cell lysates were analyzed for level of γ-H2AX. D. Representative image of Western blotting. E. Fold changes of siTOB1-induced γ-H2AX were quantitated in 3 independent experiments. Data are shown as mean values ± S.D. F. Basal level of γ-H2AX in MCF7, LCC1 and LCC9 cells. ** p<0.01 vs. MCF7.

