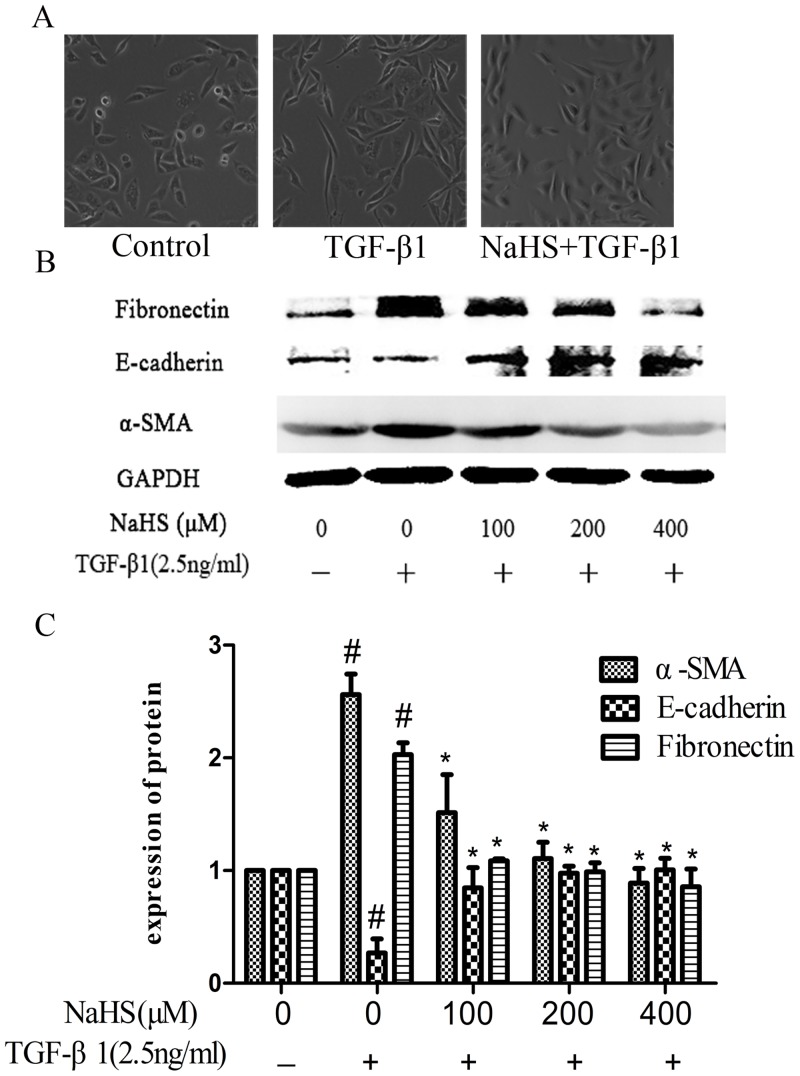
Fig 1. NaHS attenuated TGF-β1-stimulated EMT in HK-2 cells.
Pretreatment by the several concentrations of NaHS is given to HK-2 cells for 12 hours and then TGF-β1 was given to the cells for the following 36 hours. (A) The influence of 400μM NaHS on the morphological change of HK-2 cells (B) Western blot assay for fibronectin, E-cadherin and α-SMA expressions in HK-2 cells. (C) Graphical representation of the relative quantification for fibronectin, E-cadherin and α-SMA. The relative values were calculated by the density of fibronectin, E-cadherin and α-SMA vs GAPDH (%). The values of mean ± SEM (n = 3) were gained from relative abundance quantified by densitometry and normalized to GAPDH. #P<0.05 vs. control group, *P<0.05 vs TGF-β1 group. One-way ANOVA followed by Tukey’s multiple comparison test.

