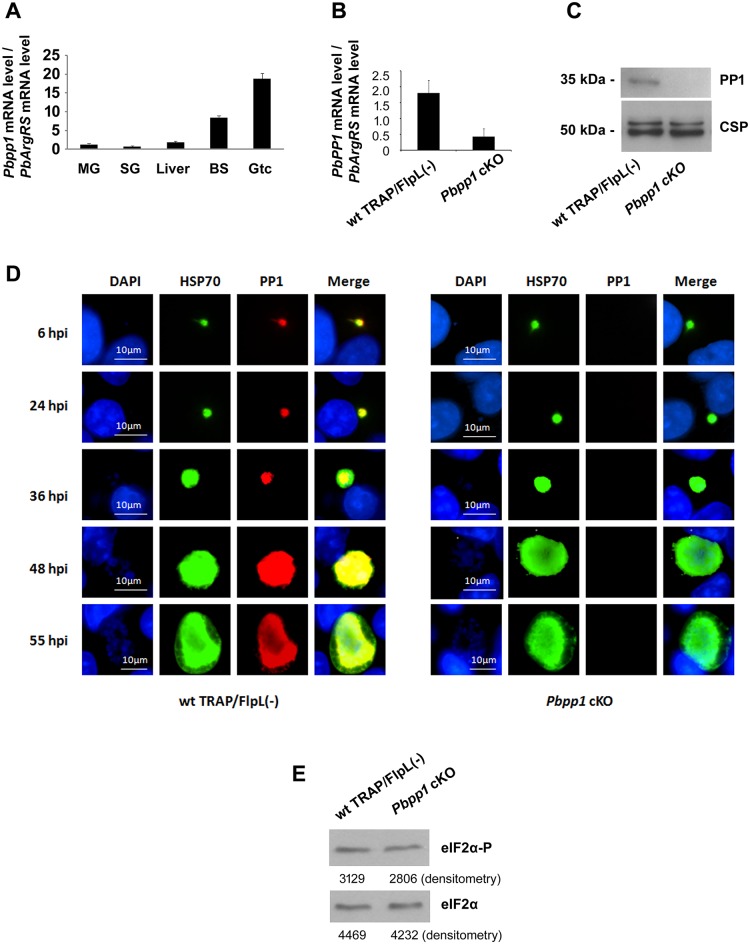
Fig 1. Characterization of Plasmodium pp1 (PBANKA_102830).
(A) pp1 mRNA levels during the P. berghei life cycle. Pbpp1 mRNA levels were analyzed by real-time PCR using cDNAs from the different stages of P. berghei. The arginyl-tRNA synthetase (PbArgRS, PB000094.03.0) was used as internal control. Each value is the mean ± SD of two independent experiments. MG: midgut; SG: salivary gland; Liver: liver stages; BS: asexual blood stages; Gtc: gametocyte. (B) Pbpp1 mRNA levels in Pbpp1 cKO Ssp were quantified by qPCR. P = 0.041. P value was calculated by t test. Shown are mean ± SD of two independent experiments. (C) Immunoblot analysis of Pbpp1 cKO and wt TRAP/FlpL(-) Ssp using anti-PbPP1 serum. CSP was used as control. (D) The liver stage development of Pbpp1 cKO Ssp in HepG2 cells was indistinguishable from the wild type TRAP/FlpL(-) Ssp. Hepatic parasites were stained with anti-PbHSP70 and anti-PbPP1 antibodies at 6h, 24h, 36h, 48h, and 55h post-infection. Bar, 10 μm. (E) eIF2α phosphorylation level in Pbpp1 cKO sporozoites was indistinguishable from wild type. Five hundred thousand wt TRAP/FlpL(-) or Pbpp1 cKO sporozoites were dissected from mosquito salivary glands. Levels of PbeIF2α-P and total PbeIF2α were quantified by densitometry analysis of immunoblots performed with antibodies against anti-eIF2α-P and anti-total eIF2α [15, 16]. Values are shown below the bands. Results were similar in two independent experiments.

