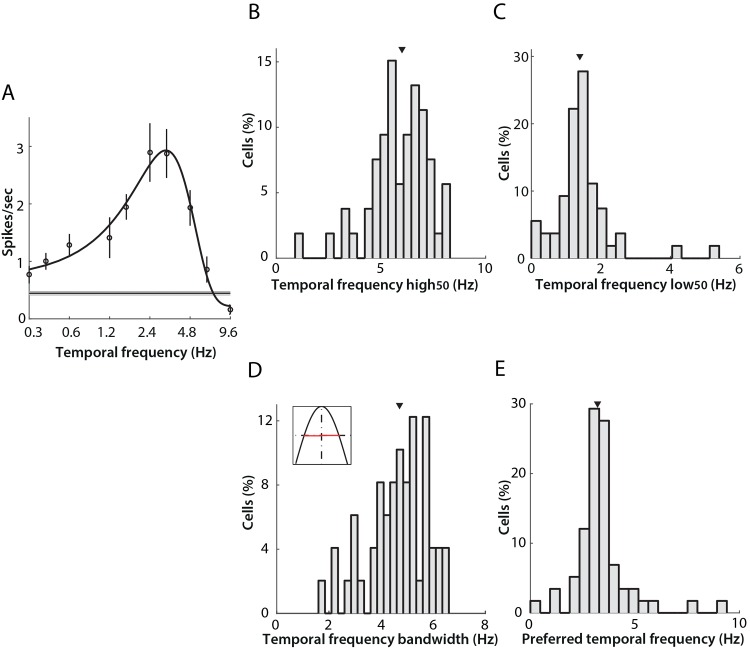
Fig 4. Band-pass temporal frequency tuning properties of neurons in mouse LGN.
A) An example of commonly encountered temporal frequency tuning profile (“band-pass”). Open circles indicate mean firing rates, and error bars the SEM across four drifting grating repeats (see Table 1). The black curve shows the best fit of a two-half-Gaussian function. The grey area indicates the SEM of spontaneous activity, with the thinner dark line indicating the mean value. Panels B-E present additional parameters measured from the band-pass subtype that represent 84.5% (49/58) of neurons in the data set. In all cases, the arrows show the median of the distribution. B) Distribution of high50 cut-off, with median 6.0 (5.3, 7.0) Hz. C) Distribution of low50 cut-off, with median 1.40 (1.07, 1.60) Hz. D) Distribution of tuning bandwidth, calculated as the difference between high50 and low50 (range illustrated in red in the inset) with median 4.70 (4.07, 5.60) Hz. E) Distribution of preferred temporal frequency with median 3.2 (2.9, 3.6) Hz.

