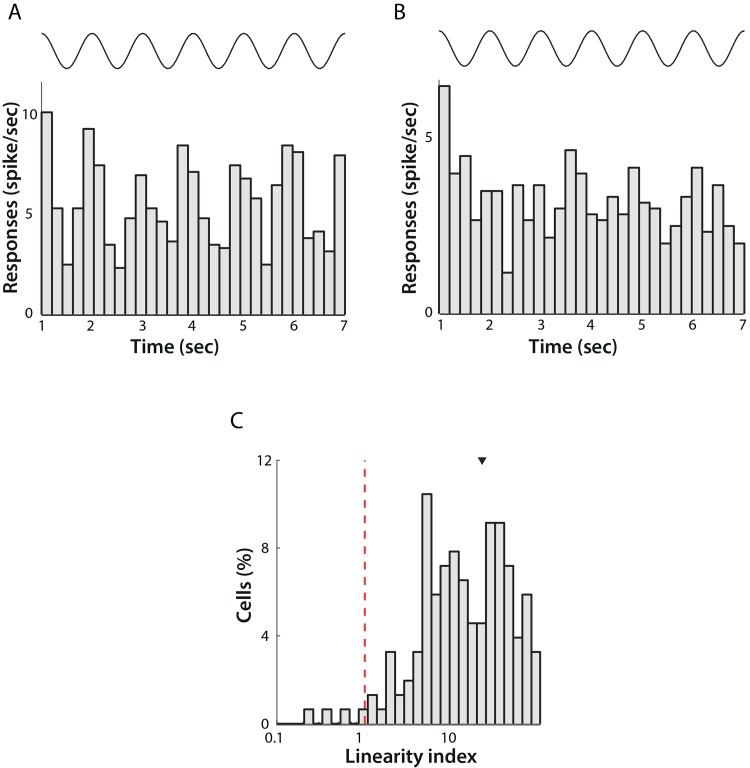
Fig 6. Linearity of LGN neuronal responses.
Activity of a single linear (A) and non-linear (B) classified cell across a 7 second presentation of a sinusoidal grating at the preferred spatial frequency of the cell with 1 Hz temporal frequency (average of 6 trials). The top trace represents the time course of the stimulus. The Linearity Index for the linear cell was 1.03 and for the non-linear cell was 0.05. C) Distribution of the Linearity Index across the population of cells. Note logarithmic scale of X-axis. The red dotted line shows the threshold for demarcating linear and non-linear responses. Four cells responded in a non-linear fashion and the remaining 88 were classified as linear in their responses.

