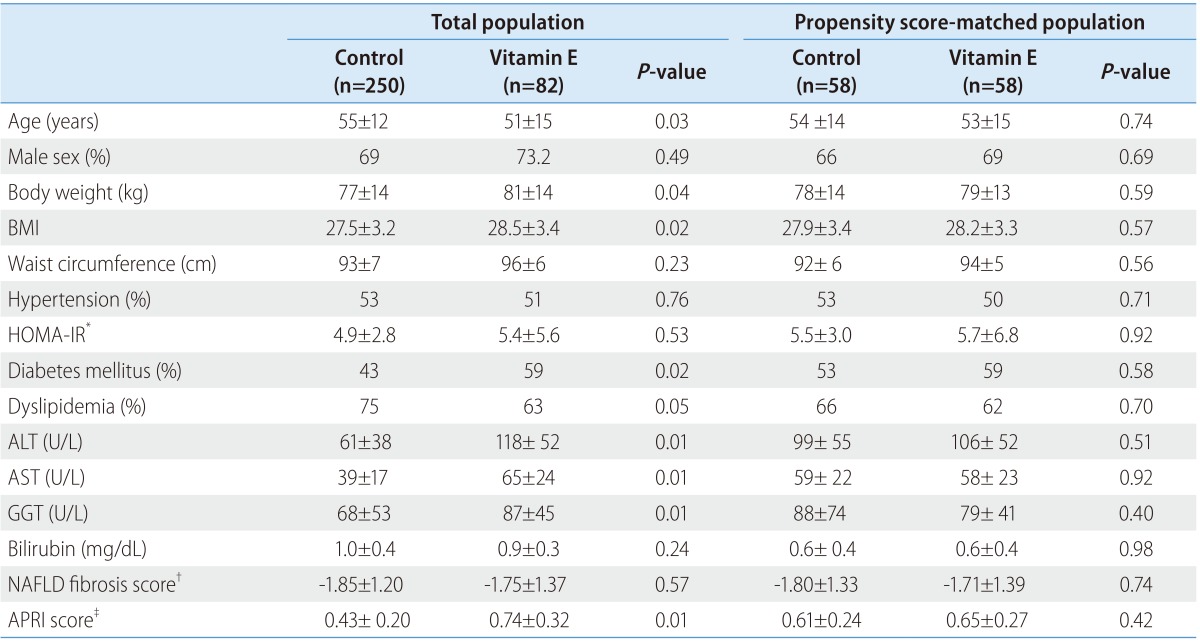
Table 1. Baseline characteristics of the study subjects.
Values are presented as mean±standard deviation or percentages.
ALT, alanine aminotransferase; AST, aspartate aminotransferase; GGT, gamma-glutamyltransferase; NAFLD, nonalcoholic fatty liver disease; APRI, AST-to-platelet ratio index; BMI, body mass index; IFG, impaired fasting glucose.
*Glucose (mg/dL) × insulin (mU/L)/405.
†NAFLD fibrosis score = -1.675 + 0.037 × age (years) + 0.094×BMI (kg/m2)+1.13×IFG/diabetes (yes=1, no=0)+0.99×AST/ALT ratio-0.013×platelet (×109/L) -0.66×albumin (g/dL).
‡AST (IU/L)/(40×platelet(×109/L))×100.

