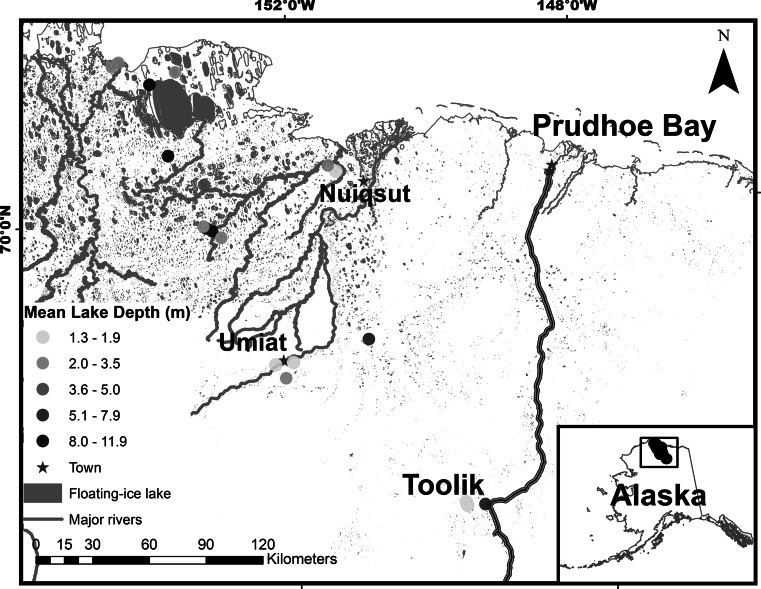
Fig. 1.
Map of the study area showing the locations of the lakes used in the analysis (dots) along with mean lake depth (color of dots), major streams (thin gray lines), and lakes with winter liquid water (gray shaded polygons) as well as the relative position of the study area in northern Alaska (Color figure online)

