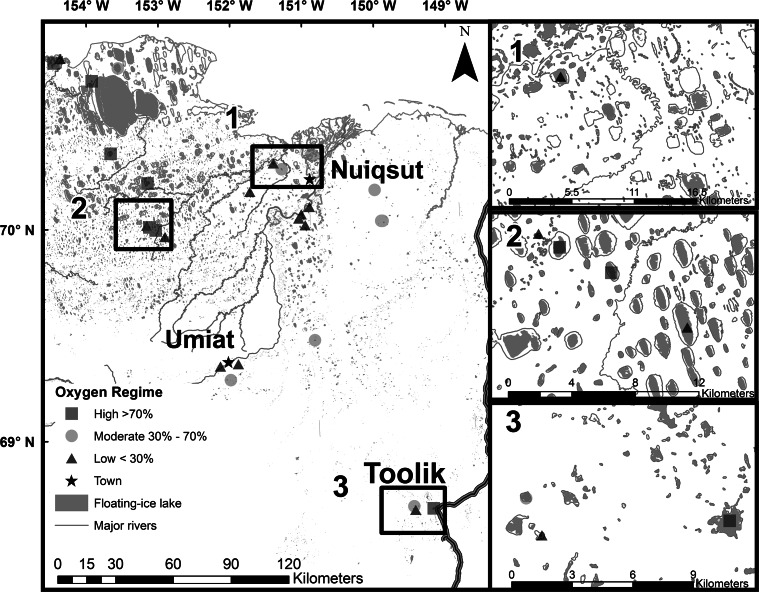
Fig. 4.
DO regimes; low (DO <30 %), Moderate (30 % ≤ DO ≤ 70 %), High (DO ≥70 %) of the lakes used in the analysis along with inset maps for areas with dense clusters of lakes. Each symbol represents one of the three DO regimes, major streams are shown as thin gray lines, and lakes with winter liquid water are represented as shaded gray polygons

