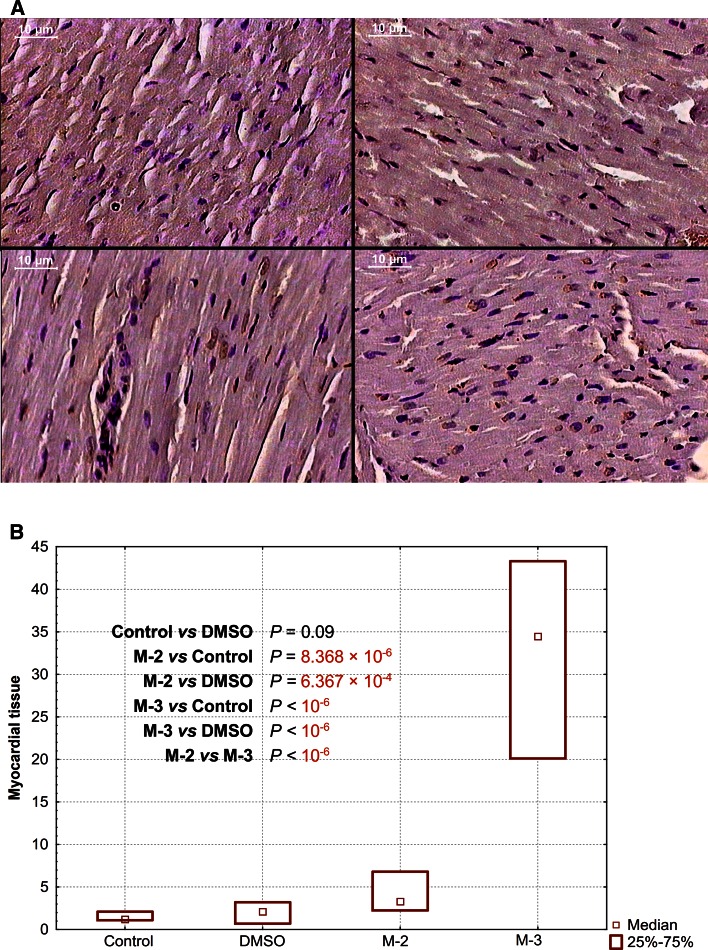
Fig. 3.
Representative images of apoptotic staining and their quantificative results in rats’ myocardial tissue after single oral pretreatment with 20 mg kg−1 of M-2 or M-3. a TUNEL reaction. Control (upper left): Only one slightly stained brownish cardiocytic nucleus was visible (TUNEL-immunocytochemistry, transmitted light, 100× magnification, bar represents 10 µm). DMSO (upper right): Scanty positively stained brownish nuclei (TUNEL-positive) and non-apoptotic dark nuclei were visible (TUNEL-immunocytochemistry, transmitted light, 100× magnification, bar represents 10 µm). M-2 (down left): TUNEL-positive cardiocytic and fibroblastic nuclei were readily recognized (TUNEL-immunocytochemistry, transmitted light, 150× magnification, bar represents 10 µm). M-3 (down right): TUNEL-positive cardiocytic and fibroblastic nuclei were prevalent (TUNEL-immunocytochemistry, transmitted light, 150× magnification, bar represents 10 µm). b. Percentage of TUNEL-positive nuclei per total nuclear area

