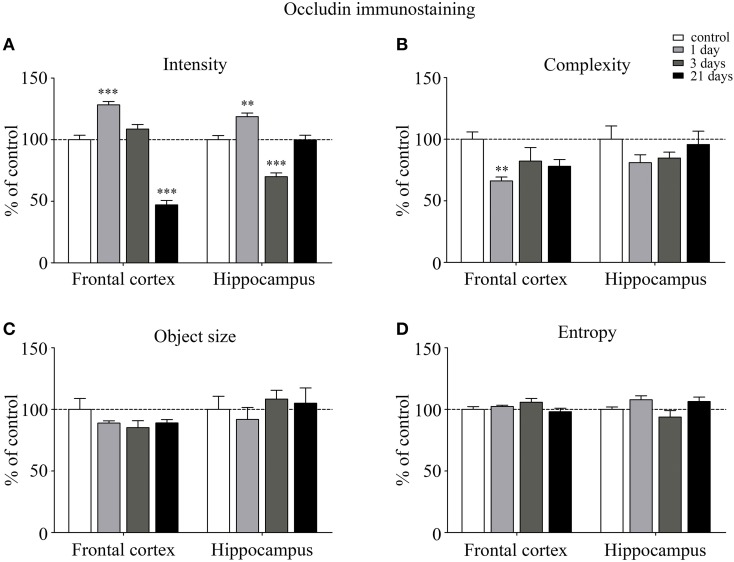
Figure 5.
Analysis of occludin immunofluorescence pattern in the frontal cortex and hippocampus of rats following restraint stress. Graphs represent quantification of the intensity (A), complexity (B), mean object size (C) and entropy (D) of immunostained samples. Results are expressed as percentages of the unstressed control group. Values for each group are means ± SEM. Data were analyzed by One-way ANOVA followed by a Bonferroni post hoc test. **p < 0.01, ***p < 0.001, significant differences as compared to the unstressed control group.

