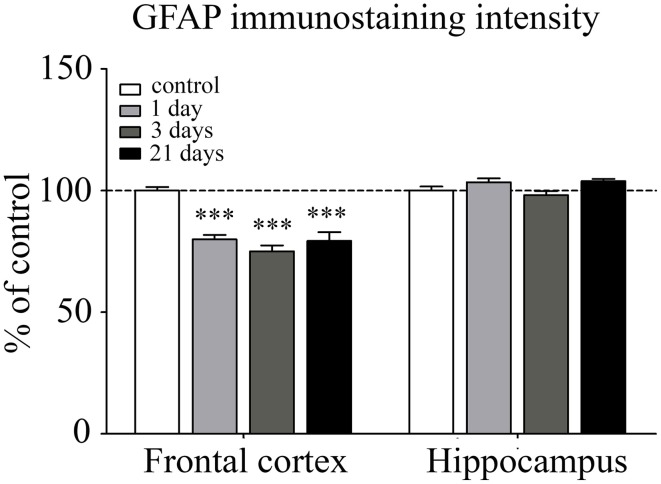
Figure 9.
Analysis of GFAP immunofluorescence pattern associated with capillaries in the frontal cortex and hippocampus of rats following restraint stress. The graph represents the fluorescence intensity of the immunostaining. Results are expressed as percentages of the unstressed control group. Values for each group are means ± SEM. Data were analyzed by One-way ANOVA followed by Kruskal–Wallis test and Dunn's multiple comparison tests. ***p < 0.001, significant differences as compared to the unstressed control group.

