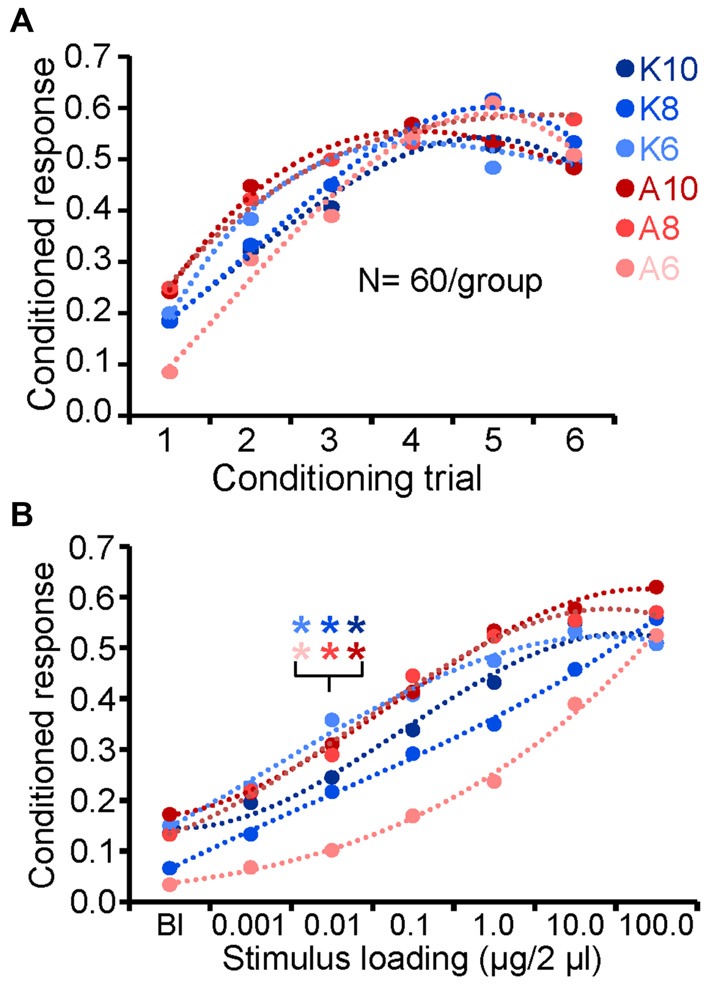
Figure 2.

Behavioral identification of detection thresholds. (A) Acquisition of the conditioned feeding response probability for each monomolecular odorant. Odors are color coded to identify moiety (ketones = blue; alcohols = reds) and shaded to indicate carbon chain length (dark = 10; medium = 8; lite = 6). (B) Conditioned feeding response probability as a function of odor stimulus loading (concentration). Results based on the average across testing days. Statistical comparison of the conditioned response (CRs) for each CS concentration with the corresponding blank (zero odor) was used to identify detection thresholds (indicated by inset asterisks; one tailed paired t-test; p < 0.05).
