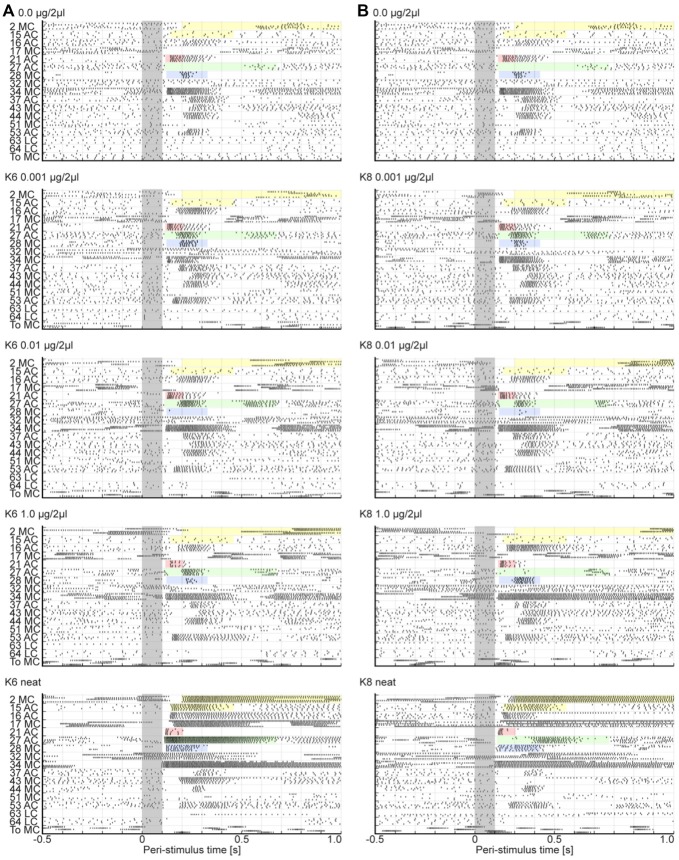
Figure 4.
Raster plots show the different PN responses types. Peri stimulus raster plots show the responses for 17 uniglomerular Projection neurons (PNs) to four stimulus loadings of K6 (A) and to K8 (B). The blank raster (top panel) is provided above each odor column in order to facilitate comparison of subtle differences in temporal details of each response. Each PN is listed on the ordinate and was named based on its glomerular association and the soma cluster from which the PN originated. For example the cell “2 MC” has dendrites in glomerulus 2 and its cell body in the medial cluster. All PNs exited the AL via the inner antenno-cerebral tract and arborized in MB calyx before terminating in the lateral protocerebrum. For each PN, five rows of hash marks represent the spikes of the five stimulus repeats. Note that all PNs had axons in the IACT. The gray bar marks the stimulus, which represents time zero. Inset coloration highlights exemplar responses. Each highlighted area in all panels corresponds to the start time and approximate duration of the response to neat K6 (bottom left most panel). This facilitates direct comparisons of responses from specific cells across loadings and odors. Abbreviations: AC, LC, MC: anterior, lateral and medial soma cluster, respectively; To: toroid.

