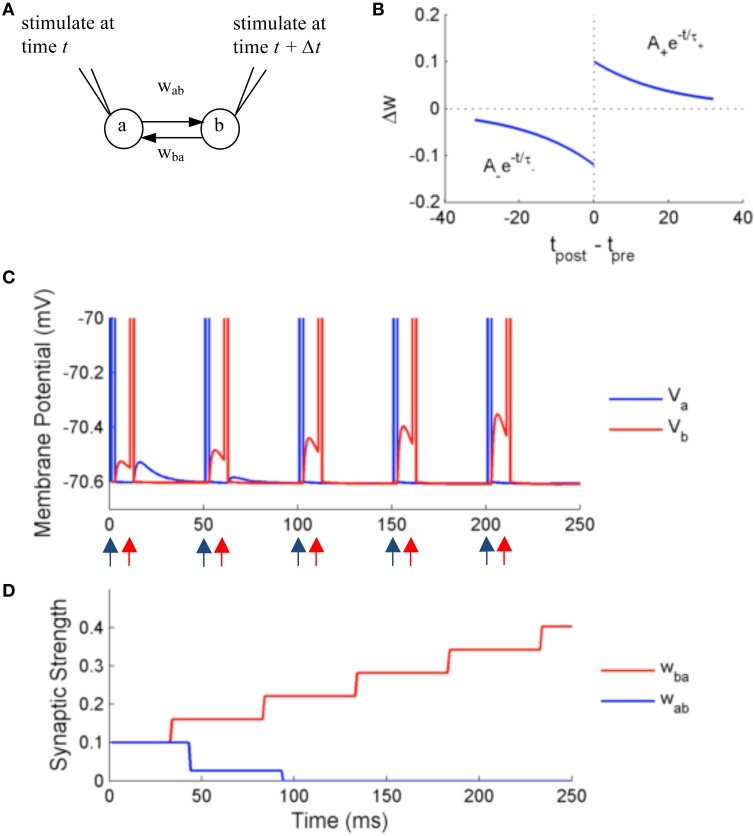
Figure 7.
Simulation using NeuroFlow with STDP enabled under the paired stimulation protocol. (A) The simulation consists of two aEIF neurons which are mutually connected. Each of them receives an alternate stimulation of 10 mA for 250 ms. (B) The STDP profile used for the simulation, with A+ = 0.1, A− = 0.12 and τ+ = τ− = 20 ms (C) Traces of membrane voltage of the two neurons with spike time difference of 10 ms. The neurons spike upon receiving the external stimulation, where blue (red) arrows correspond to the time when neuron a (neuron b) receives external stimulation in the diagram. (D) Evolution of the strength of synaptic coupling between the two neurons across time in the trial described in (C).

