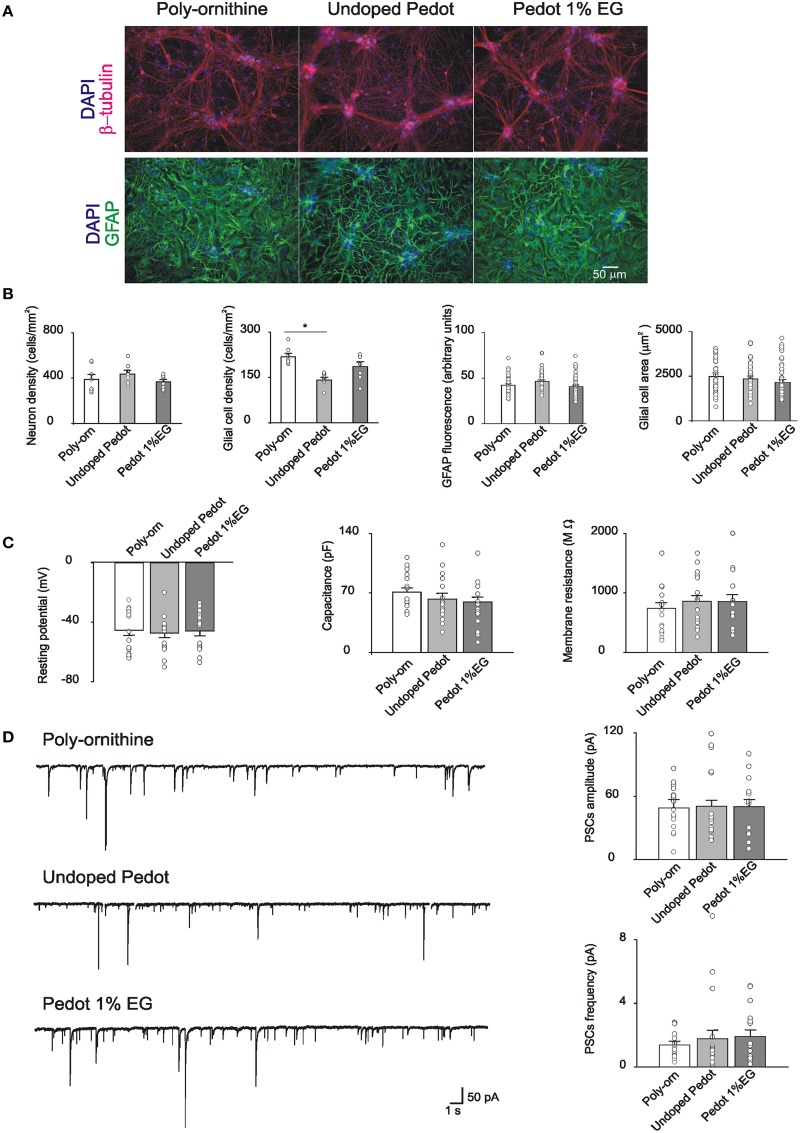
Figure 2.
(A) Immunofluorescence images of cultures grown on poly-ornithine, undoped PEDOT:PSS (0% EG) and PEDOT:PSS 1% EG. Cells were stained with antibodies anti-β-tubulin (red), GFAP (green) and nuclei were marked with DAPI (blue) (B). Bar plots show mean values of neuronal and glial cells density, GFAP fluorescence intensity and glial cells areas in the different conditions of growth. Superimposed dots to the bars are values from single fields (for cell density) or from single cells (for GFAP intensity and glial cell areas). Note that the glial cell density is significantly decreased on undoped PEDOT:PSS respect to the poly-ornithine control (*p < 0.05, T-test). (C) Bar plots are mean values of resting membrane potentials, capacitance and membrane resistance. Superimposed dots to the bars are values from single experiments. (D) On the left, exemplificative recordings from neurons grown on poly-ornithine, undoped PEDOT:PSS and PEDOT:PSS 1% EG respectively. On the right, bar plots show the means values of spontaneous PSCs amplitude and frequency in the different conditions of growth. Superimposed dots to the bar are values from single experiments.

